Details
-
Help
-
Resolution: Incomplete
-
 Major
Major
-
None
-
Enterprise Edition
-
None
-
Observium Enterprise server 24.8.13606
Description
Our active Observium Enterprise subscription: franceix-34629002
Hello there is an issue we are facing on our setup of Observium Entreprise with multiple distributed pollers.
The curent context is :
- We have an Observium Enterprise server running on version 24.8.13606
- The Observium server is running under a Debian 12 Proxmox VM with rrdcached and Mariadb 10.11.6
- We have 9 distributed pollers accross 3 different datacenters in Paris region, each in a debian 12 VM, running in the same proxmox cluster as the Observium Server VM
- The pollers share the same level2 EVPN MPLS network as the Observium server for the Paris region.
- We also have other distributed pollers in Debian 12 vms in other regions such as Marseille, Toulouse, Lyon and Lille. The pollers are not in the L2 EVPN network as the Observium server
- We configured an alert-checker per poller in our Observium server
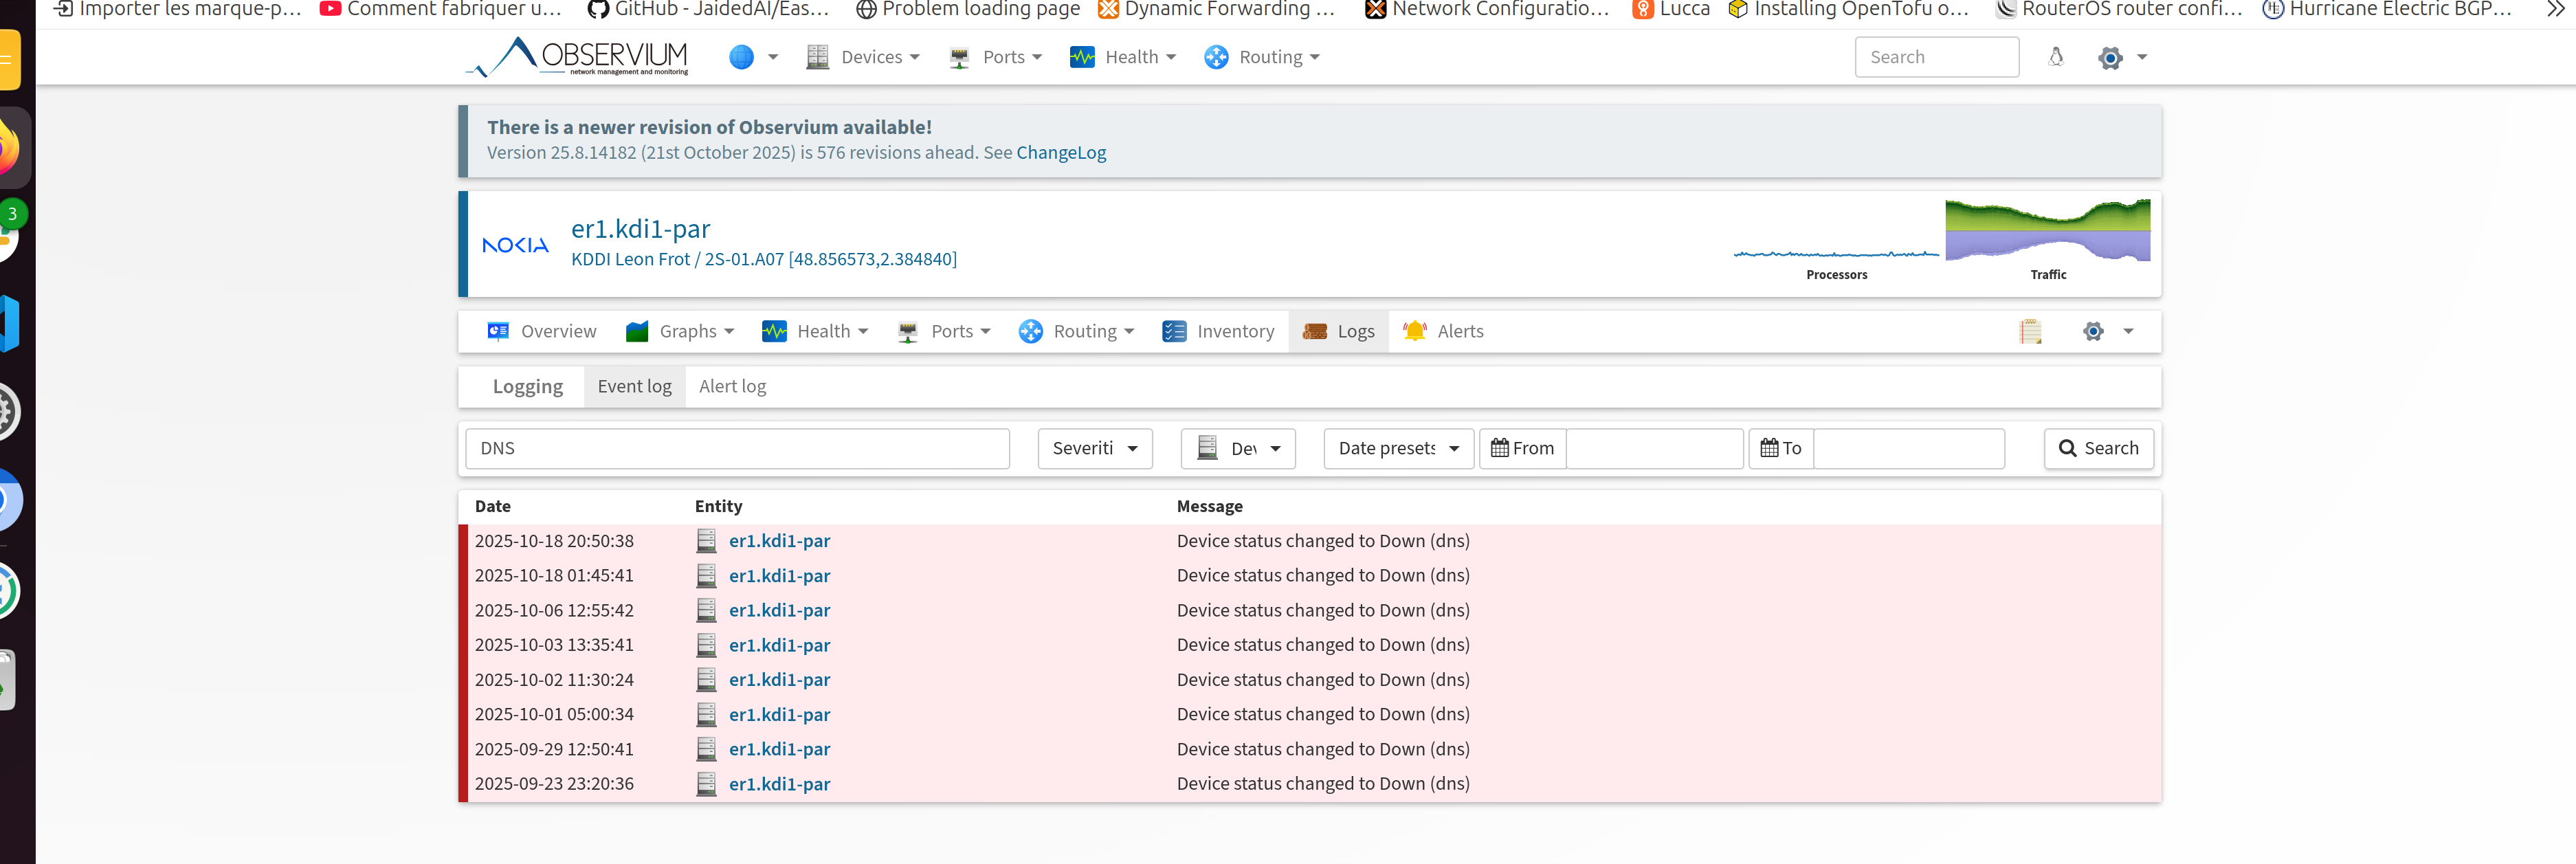
We often have occurences of alerts from specific Observium pollers. It happens randomly, it does not happen on a specific time range. Though, there is no problem shown on the devices that concerned by the alerts. You may find attached a screenshot containing the logs of an impacted device. The logs shows "dns", so we also made sure that our dns resolvers and dns authoritative servers are in working order.
We only have device_down alerts from the pollers that are located on the 2 other sites of Paris than the one which contains the Observium server VM. We have no alerts from the pollers in the site that hosts Observium server and even from the ones that are located in the remote region sites (Marseille, Lille..)
We started to notice those alerts since we changed the alert delay from initially 1 to 0 in all our device_down alert checkers. We configured logs in all our distributed pollers and we saw that there was a problem reaching its database during a spcific poll with a log showing "db has gone away" which generated an alert. That's why we suspected an issue of tuning on the database, thereforce we increased some timeouts to 300 seconds instead of 180. You can find attached our database configuration.
We ran ping test continuously through tools such as uptime-kuma between the impacted sites and the Observium server. We did not see any disruption. Although, we noticed an http check to Observium URL that took more than 3000ms during one of the alert occurences without any logs of Apache2 related to it.
We need to adress this issue, since it has begun to impact the reliability of our monitoring through Observium.
I'am at your disposal for any further information you may need to guide us in the troubleshooting of this issue.
I thank you for the attention you will be able to give to our issue.
Regards,
Attachments
Issue Links
- is mentioned by
-
OBS-5211 `poller-wrapper.py` distributed-poller SQL uses `@rownum := @rownum + 1` — non-deterministic on MariaDB 10.3+, causes random device reshuffling between cron ticks and NaN gaps in RRDs
-
- Resolved
-