Details
-
Vendor Bug
-
Resolution: Won't Fix
-
Major
-
None
-
Professional Edition
-
None
Description
Hello
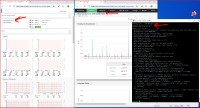
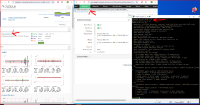
For some reason observium doesn’t display graphs for some interfaces in cisco nexus devices.
I can see everything up to Ethernet110/1/48 and nothing after that in observium. But in other monitoring software there is no such issue.
I have some phantom FEX interfaces 114/1/1-48, 164/1/1-164/1/32, 198/1/1-198/1/16 and 199/1/1-199/1/16 that I cannot get rid of.
It seems that the problem starts from from where the phantom interfaces first start (Eth114/1/1), but I am not sure if these have anything to do with it.
Could you please help me with this issue?
Please see the screenshots and files also

