Details
-
New Feature
-
Resolution: Unresolved
-
 Major
Major
-
None
-
Professional Edition
Description
Hey there,
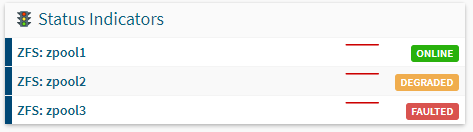
we would be happy to have a ZOL integration. An agent that could read the pools and collect the status of the pools and then display them as a status indicator.
We run some storages with ZOL and would be very happy about such a feature!