Uploaded image for project: 'Observium'
  1. Observium
  2. OBS-2464

r8892 Appears to Break Uptime Monitoring on Linux Systems

Details

    • Bug
    • Resolution: Fixed
    • Minor
    • None
    • Professional Edition
    • Poller
    • None
    • SLES 11/12 and RHEL 7

    Description

      Hi,

      r8892 breaks uptime monitoring on Linux servers, as far as we can see. I've just updated to 8893 and received a device rebooted alert for 30+ servers, and for those servers, the reported uptime is wrong. Seems to be newer distros only. Old CentOS boxes aren't affected, but new RHEL and SLES ones are.

      SVN log shows:
      r8892 | mike | 2017-10-12 14:11:41 +0100 (Thu, 12 Oct 2017) | 2 lines

      [MINOR] Prioritizing snmpEngineTime over hrSystemUptime and sysUptime. Clean old geolocation parts.

      This seems to be the wrong thing to do for Linux systems, because only hrSystemUptime seems to report the correct system uptime, as reported by the "uptime" command.

      For example, we've a server that has been up for 15 days, 22 hours.
      $ uptime
      14:43pm up 15 days 22:39, 1 user, load average: 0.02, 0.05, 0.01

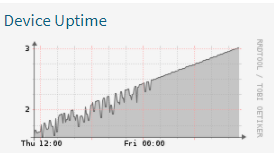
      Observium's device page now reports it as Uptime 3h 50m 35s

      snmpwalk shows this:
      DISMAN-EVENT-MIB::sysUpTimeInstance = Timeticks: (1300251) 3:36:42.51
      SNMP-FRAMEWORK-MIB::snmpEngineTime.0 = INTEGER: 13357 seconds
      HOST-RESOURCES-MIB::hrSystemUptime.0 = Timeticks: (137807404) 15 days, 22:47:54.04

      Please can this priority be fixed.

      Thanks,

      Steven

      Attachments

        Activity

          [OBS-2464] r8892 Appears to Break Uptime Monitoring on Linux Systems

          Looks to have fixed it!

          fadly.tabrani@gmail.com Fadly Tabrani added a comment - Looks to have fixed it!

          Confirmed, fixed in r8918. No incorrect "device rebooted" alerts since updating.


          Thanks!

          stevenr Steven Robson added a comment - Confirmed, fixed in r8918. No incorrect "device rebooted" alerts since updating.   Thanks!

          Fixed in r8918.

          landy Mike Stupalov added a comment - Fixed in r8918.

          fadly.tabrani@gmail.com Can you provide temporarry (ssh) access to you observium server? I want to catch why this happen.

          If possible write to me p.mail: mike@observium.org

          landy Mike Stupalov added a comment - fadly.tabrani@gmail.com Can you provide temporarry (ssh) access to you observium server? I want to catch why this happen. If possible write to me p.mail: mike@observium.org
          fadly.tabrani@gmail.com Fadly Tabrani added a comment - - edited

          On 17.10.8912 , these are happening on my RHEL7 bozes as well, and they have not been rebooted lately.

          2017-10-19 10:46:22 hostxxx hostxxx.xxx.com Device rebooted: after 1 day, 18h 55m 36s
          2017-10-19 10:21:15 hostxxx hostxxx.xxx.com Device rebooted: after 1 day, 18h 30m 30s
          2017-10-19 10:01:26 hostxxx hostxxx.xxx.com Device rebooted: after 1 day, 18h 10m 38s
          2017-10-19 09:41:20 hostxxx hostxxx.xxx.com Device rebooted: after 1 day, 17h 50m 44s
          2017-10-19 09:31:22 hostxxx hostxxx.xxx.com Device rebooted: after 1 day, 17h 40m 40s
          2017-10-19 09:11:24 hostxxx hostxxx.xxx.com Device rebooted: after 1 day, 17h 20m 35s
          2017-10-19 08:21:18 hostxxx hostxxx.xxx.com Device rebooted: after 1 day, 16h 30m 37s
          2017-10-19 07:51:15 hostxxx hostxxx.xxx.com Device rebooted: after 1 day, 16h 37s
          2017-10-19 07:41:12 hostxxx hostxxx.xxx.com Device rebooted: after 1 day, 15h 50m 33s
          2017-10-19 07:26:16 hostxxx hostxxx.xxx.com Device rebooted: after 1 day, 15h 35m 32s
          2017-10-19 06:11:12 hostxxx hostxxx.xxx.com Device rebooted: after 1 day, 14h 20m 31s
          2017-10-19 05:51:16 hostxxx hostxxx.xxx.com Device rebooted: after 1 day, 14h 32s
          2017-10-19 04:51:15 hostxxx hostxxx.xxx.com Device rebooted: after 1 day, 13h 45s
          2017-10-19 04:31:18 hostxxx hostxxx.xxx.com Device rebooted: after 1 day, 12h 40m 34s
          2017-10-19 04:11:19 hostxxx hostxxx.xxx.com Device rebooted: after 1 day, 12h 20m 37s
          2017-10-19 04:01:25 hostxxx hostxxx.xxx.com Device rebooted: after 1 day, 12h 10m 43s
          2017-10-19 03:16:15 hostxxx hostxxx.xxx.com Device rebooted: after 1 day, 11h 25m 37s
          2017-10-19 03:01:21 hostxxx hostxxx.xxx.com Device rebooted: after 1 day, 11h 10m 32s

          fadly.tabrani@gmail.com Fadly Tabrani added a comment - - edited On 17.10.8912 , these are happening on my RHEL7 bozes as well, and they have not been rebooted lately. 2017-10-19 10:46:22 hostxxx hostxxx.xxx.com Device rebooted: after 1 day, 18h 55m 36s 2017-10-19 10:21:15 hostxxx hostxxx.xxx.com Device rebooted: after 1 day, 18h 30m 30s 2017-10-19 10:01:26 hostxxx hostxxx.xxx.com Device rebooted: after 1 day, 18h 10m 38s 2017-10-19 09:41:20 hostxxx hostxxx.xxx.com Device rebooted: after 1 day, 17h 50m 44s 2017-10-19 09:31:22 hostxxx hostxxx.xxx.com Device rebooted: after 1 day, 17h 40m 40s 2017-10-19 09:11:24 hostxxx hostxxx.xxx.com Device rebooted: after 1 day, 17h 20m 35s 2017-10-19 08:21:18 hostxxx hostxxx.xxx.com Device rebooted: after 1 day, 16h 30m 37s 2017-10-19 07:51:15 hostxxx hostxxx.xxx.com Device rebooted: after 1 day, 16h 37s 2017-10-19 07:41:12 hostxxx hostxxx.xxx.com Device rebooted: after 1 day, 15h 50m 33s 2017-10-19 07:26:16 hostxxx hostxxx.xxx.com Device rebooted: after 1 day, 15h 35m 32s 2017-10-19 06:11:12 hostxxx hostxxx.xxx.com Device rebooted: after 1 day, 14h 20m 31s 2017-10-19 05:51:16 hostxxx hostxxx.xxx.com Device rebooted: after 1 day, 14h 32s 2017-10-19 04:51:15 hostxxx hostxxx.xxx.com Device rebooted: after 1 day, 13h 45s 2017-10-19 04:31:18 hostxxx hostxxx.xxx.com Device rebooted: after 1 day, 12h 40m 34s 2017-10-19 04:11:19 hostxxx hostxxx.xxx.com Device rebooted: after 1 day, 12h 20m 37s 2017-10-19 04:01:25 hostxxx hostxxx.xxx.com Device rebooted: after 1 day, 12h 10m 43s 2017-10-19 03:16:15 hostxxx hostxxx.xxx.com Device rebooted: after 1 day, 11h 25m 37s 2017-10-19 03:01:21 hostxxx hostxxx.xxx.com Device rebooted: after 1 day, 11h 10m 32s

          Another example:

          Observium web interface and alert email:
          Uptime 30m 13s

          SSH uptime:
          12:16pm up 89 days 13:38, 1 user, load average: 0.16, 0.11, 0.09

          2017-10-18 12:15:17 servername Device rebooted: after 89 days, 13h 31m 58s
          2017-10-18 12:00:33 servername Device rebooted: after 89 days, 13h 16m 56s
          2017-10-17 12:50:26 servername Device rebooted: after 88 days, 14h 7m 3s
          2017-10-16 11:45:52 servername Device rebooted: after 87 days, 13h 1m 31s
          2017-10-13 14:30:08 servername Device rebooted: after 84 days, 15h 47m 6s

          SNMP-FRAMEWORK-MIB::snmpEngineBoots.0 = INTEGER: 790
          SNMP-FRAMEWORK-MIB::snmpEngineTime.0 = INTEGER: 1863 seconds
          DISMAN-EVENT-MIB::sysUpTimeInstance = Timeticks: (186451) 0:31:04.51
          HOST-RESOURCES-MIB::hrSystemUptime.0 = Timeticks: (773865179) 89 days, 13:37:31.79

          A few minutes later, the uptime shown in the Observium web interface is:
          Uptime 89 days, 13h 46m 46s


          stevenr Steven Robson added a comment - Another example: Observium web interface and alert email: Uptime 30m 13s SSH uptime: 12:16pm up 89 days 13:38, 1 user, load average: 0.16, 0.11, 0.09 2017-10-18 12:15:17 servername Device rebooted: after 89 days, 13h 31m 58s 2017-10-18 12:00:33 servername Device rebooted: after 89 days, 13h 16m 56s 2017-10-17 12:50:26 servername Device rebooted: after 88 days, 14h 7m 3s 2017-10-16 11:45:52 servername Device rebooted: after 87 days, 13h 1m 31s 2017-10-13 14:30:08 servername Device rebooted: after 84 days, 15h 47m 6s SNMP-FRAMEWORK-MIB::snmpEngineBoots.0 = INTEGER: 790 SNMP-FRAMEWORK-MIB::snmpEngineTime.0 = INTEGER: 1863 seconds DISMAN-EVENT-MIB::sysUpTimeInstance = Timeticks: (186451) 0:31:04.51 HOST-RESOURCES-MIB::hrSystemUptime.0 = Timeticks: (773865179) 89 days, 13:37:31.79 A few minutes later, the uptime shown in the Observium web interface is: Uptime 89 days, 13h 46m 46s  
          stevenr Steven Robson added a comment - - edited

          I was wrong. In some circumstances, Observium is using the wrong OID for system uptime, and reports this in the web interface, and then alerts. So there's still something wrong with the way it's detecting uptime for these systems.


          Using r8912


          Example:

          Uptime in the web interface was reported as about 5mins (refreshed before I could catch the exact value)

          uptime (via ssh)
          11:09am up 2 days 0:26, 1 user, load average: 0.14, 0.09, 0.06

          SNMP-FRAMEWORK-MIB::snmpEngineBoots.0 = INTEGER: 835
          SNMP-FRAMEWORK-MIB::snmpEngineTime.0 = INTEGER: 670 seconds

          DISMAN-EVENT-MIB::sysUpTimeInstance = Timeticks: (64400) 0:10:44.00

          HOST-RESOURCES-MIB::hrSystemUptime.0 = Timeticks: (17443127) 2 days, 0:27:11.27


          The alert email reports  Uptime 5m 33s 


          So, I don't think uptime is faithful for these systems, but is corrected on a later poll and then breaks again.

          The event log for the device shows:

          2017-10-18 11:05:35 servername Device rebooted: after 2 days, 16m 33s
          2017-10-16 16:15:39 servername Device rebooted: after 5h 27m 7s
          2017-10-16 14:55:30 servername Device rebooted: after 4h 6m 53s
          2017-10-16 14:25:49 servername Device rebooted: after 3h 20m 4s
          2017-10-16 14:20:10 servername Device rebooted: after 3h 32m 8s
          2017-10-16 14:10:33 servername Device rebooted: after 3h 22m 12s
          2017-10-16 14:00:26 servername Device rebooted: after 3h 12m 3s
          2017-10-16 13:50:28 servername Device rebooted: after 3h 1m 46s
          2017-10-16 13:20:09 servername Device rebooted: after 2h 32m 7s
          2017-10-16 13:00:57 servername Device rebooted: after 2h 12m 12s
          2017-10-16 12:20:33 servername Device rebooted: after 1h 32m 16s
          2017-10-16 11:10:44 servername Device rebooted: after 22m 20s
          2017-10-16 11:01:09 servername Device rebooted: after 10m 40s


          If I check the uptime now, it shows correctly as 2 days, 32m 6s


          stevenr Steven Robson added a comment - - edited I was wrong. In some circumstances, Observium is using the wrong OID for system uptime, and reports this in the web interface, and then alerts. So there's still something wrong with the way it's detecting uptime for these systems.   Using r8912   Example: Uptime in the web interface was reported as about 5mins (refreshed before I could catch the exact value) uptime (via ssh) 11:09am up 2 days 0:26, 1 user, load average: 0.14, 0.09, 0.06 SNMP-FRAMEWORK-MIB::snmpEngineBoots.0 = INTEGER: 835 SNMP-FRAMEWORK-MIB::snmpEngineTime.0 = INTEGER: 670 seconds DISMAN-EVENT-MIB::sysUpTimeInstance = Timeticks: (64400) 0:10:44.00 HOST-RESOURCES-MIB::hrSystemUptime.0 = Timeticks: (17443127) 2 days, 0:27:11.27   The alert email reports  Uptime 5m 33s    So, I don't think uptime is faithful for these systems, but is corrected on a later poll and then breaks again. The event log for the device shows: 2017-10-18 11:05:35 servername Device rebooted: after 2 days, 16m 33s 2017-10-16 16:15:39 servername Device rebooted: after 5h 27m 7s 2017-10-16 14:55:30 servername Device rebooted: after 4h 6m 53s 2017-10-16 14:25:49 servername Device rebooted: after 3h 20m 4s 2017-10-16 14:20:10 servername Device rebooted: after 3h 32m 8s 2017-10-16 14:10:33 servername Device rebooted: after 3h 22m 12s 2017-10-16 14:00:26 servername Device rebooted: after 3h 12m 3s 2017-10-16 13:50:28 servername Device rebooted: after 3h 1m 46s 2017-10-16 13:20:09 servername Device rebooted: after 2h 32m 7s 2017-10-16 13:00:57 servername Device rebooted: after 2h 12m 12s 2017-10-16 12:20:33 servername Device rebooted: after 1h 32m 16s 2017-10-16 11:10:44 servername Device rebooted: after 22m 20s 2017-10-16 11:01:09 servername Device rebooted: after 10m 40s   If I check the uptime now, it shows correctly as 2 days, 32m 6s  
          landy Mike Stupalov added a comment - - edited

          Uptime must be faithful (in your case from hrSystemUptime.0)..

          Since was troubles with detect uptime some time ago, this is normal for some incorrect reboot triggers too.

          But you still see reboot event logs for this devices (how often)?

          landy Mike Stupalov added a comment - - edited Uptime must be faithful (in your case from hrSystemUptime.0).. Since was troubles with detect uptime some time ago, this is normal for some incorrect reboot triggers too. But you still see reboot event logs for this devices (how often)?

          Looking at this some more, it seems that uptime reporting in the device view is now correct for all affected devices, but something's still wrong with the logic behind "has the device rebooted" for the alert check.

          stevenr Steven Robson added a comment - Looking at this some more, it seems that uptime reporting in the device view is now correct for all affected devices, but something's still wrong with the logic behind "has the device rebooted" for the alert check.

          This doesn't appear to be fixed on r8910. We get multiple "device rebooted" alerts per day for most Linux servers, and on some of them, extending snmpd isn't an option (Linux-based appliances). Only Linux devices seem to be affected. 

          One such server:

          HOST-RESOURCES-MIB::hrSystemUptime.0 = Timeticks: (2114597183) 244 days, 17:52:51.83

          SNMPv2-SMI::enterprises.15601.1.1.0 = Timeticks: (2114597864) 244 days, 17:52:58.64

          SNMP-FRAMEWORK-MIB::snmpEngineBoots.0 = INTEGER: 287
          SNMP-FRAMEWORK-MIB::snmpEngineTime.0 = INTEGER: 3869 seconds

          DISMAN-EVENT-MIB::sysUpTimeInstance = Timeticks: (385986) 1:04:19.86

          Uptime is reported correctly in the web interface:

          Uptime 244 days, 17h 59m 15s


          However, for other servers, it's reported incorrectly, e.g:

          Observium Alert Uptime 1h 39s 

          16:34pm  up 90 days 18:56,  1 user,  load average: 0.11, 0.09, 0.09

          HOST-RESOURCES-MIB::hrSystemUptime.0 = Timeticks: (784425551) 90 days, 18:57:35.51

          SNMPv2-SMI::enterprises.15601.1.1.0 = Timeticks: (784427721) 90 days, 18:57:57.21

          SNMP-FRAMEWORK-MIB::snmpEngineBoots.0 = INTEGER: 909
          SNMP-FRAMEWORK-MIB::snmpEngineTime.0 = INTEGER: 3960 seconds

          DISMAN-EVENT-MIB::sysUpTimeInstance = Timeticks: (392875) 1:05:28.75


          But Observium thinks the server has recently rebooted in both cases - we got an alert and it's shown on the Observium homepage. 

          The alert check is "device_rebooted eq 1" (also tried ne 0).


          stevenr Steven Robson added a comment - This doesn't appear to be fixed on r8910. We get multiple "device rebooted" alerts per day for most Linux servers, and on some of them, extending snmpd isn't an option (Linux-based appliances). Only Linux devices seem to be affected.  One such server: HOST-RESOURCES-MIB::hrSystemUptime.0 = Timeticks: (2114597183) 244 days, 17:52:51.83 SNMPv2-SMI::enterprises.15601.1.1.0 = Timeticks: (2114597864) 244 days, 17:52:58.64 SNMP-FRAMEWORK-MIB::snmpEngineBoots.0 = INTEGER: 287 SNMP-FRAMEWORK-MIB::snmpEngineTime.0 = INTEGER: 3869 seconds DISMAN-EVENT-MIB::sysUpTimeInstance = Timeticks: (385986) 1:04:19.86 Uptime is reported correctly in the web interface: Uptime 244 days, 17h 59m 15s   However, for other servers, it's reported incorrectly, e.g: Observium Alert Uptime 1h 39s  16:34pm  up 90 days 18:56,  1 user,  load average: 0.11, 0.09, 0.09 HOST-RESOURCES-MIB::hrSystemUptime.0 = Timeticks: (784425551) 90 days, 18:57:35.51 SNMPv2-SMI::enterprises.15601.1.1.0 = Timeticks: (784427721) 90 days, 18:57:57.21 SNMP-FRAMEWORK-MIB::snmpEngineBoots.0 = INTEGER: 909 SNMP-FRAMEWORK-MIB::snmpEngineTime.0 = INTEGER: 3960 seconds DISMAN-EVENT-MIB::sysUpTimeInstance = Timeticks: (392875) 1:05:28.75   But Observium thinks the server has recently rebooted in both cases - we got an alert and it's shown on the Observium homepage.  The alert check is "device_rebooted eq 1" (also tried ne 0).    

          People

            landy Mike Stupalov
            stevenr Steven Robson
            Votes:
            0 Vote for this issue
            Watchers:
            4 Start watching this issue

            Dates

              Created:
              Updated:
              Resolved: