Details
-
Bug
-
Resolution: Incomplete
-
Major
-
None
-
Professional Edition
-
None
-
OS : CentOS 6.7 (64Bit)
RAM : 8GB
CPU : 3
This is a VM machine running on ESXi6
Description
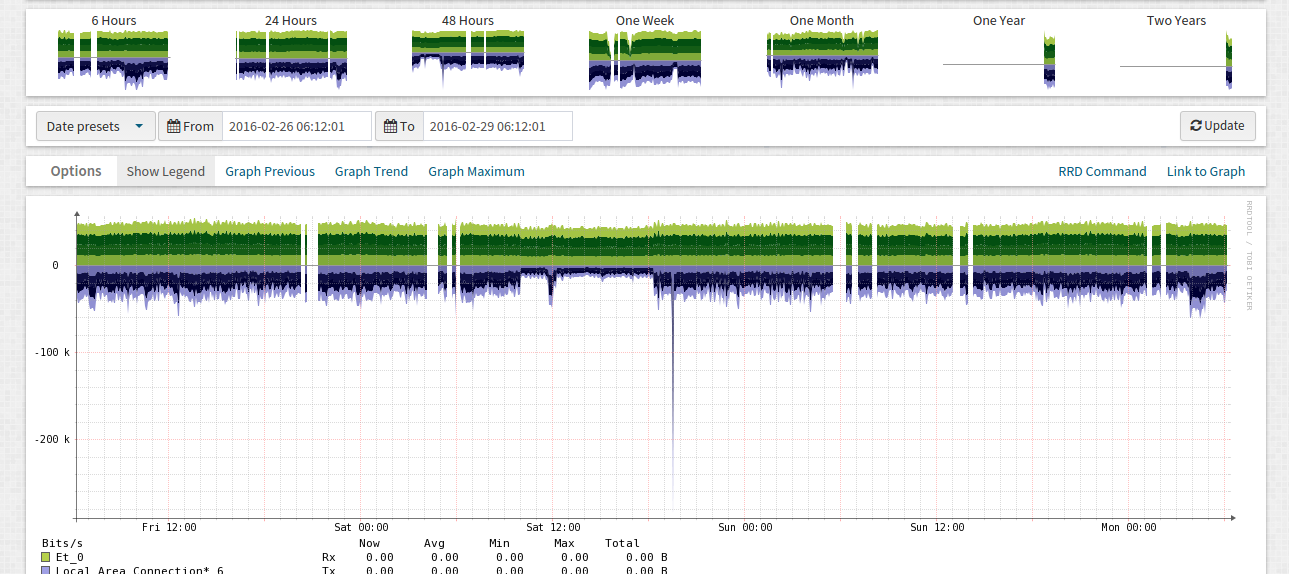
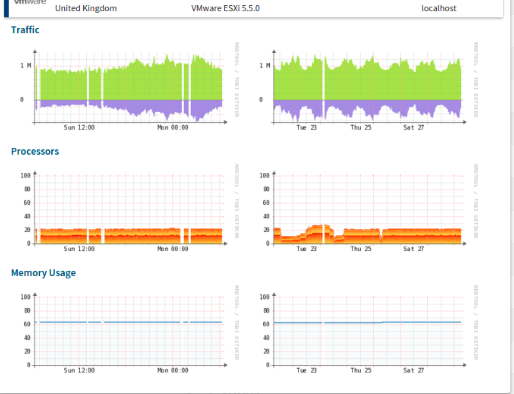
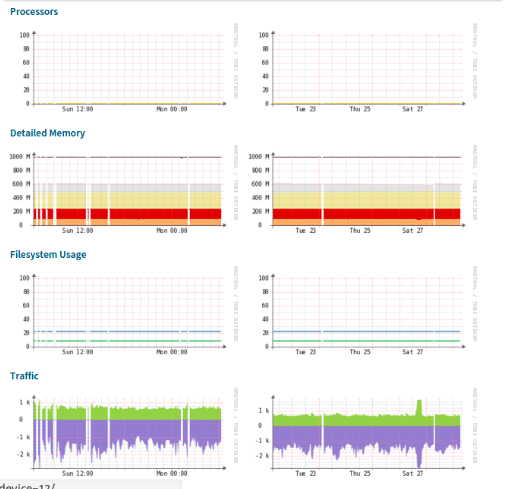
Recently I purchased Enterprise edition. Initially I haven't hit with any issue. But all of sudden , there is some white space[ not plotting] on my graphs. Not sure what happened all of sudden. Even I updated the package with latest version. Though, Still its no luck.
Note : I couldn't notice any error in the log.
Moreover , I purchased this product to overcome my existing monitoring system which have less info compare to observium. But this unknown issues are too weird to me. Since My old monitoring system doesn't have any issue in plotting.
Attachments
Activity
Workflow | Original: classic default workflow [ 12834 ] | New: Observium workflow [ 14703 ] |
Resolution | New: Incomplete [ 4 ] | |
Status | Original: Open [ 1 ] | New: Closed [ 6 ] |
I had this same problem but it started once I added more devices (I have 33 devices now and I have more to add) and after a couple weeks of testing, I found that I needed to change how many poller instances I have running. I started with turnkey observium and that was running one poller instance. I moved over to ubuntu 16.04 server and installed observiem. It ran great with 15 devices on 4 poller instances but once I added more I started to have gaps in the graphs and SMNP errors.
This page gives you some good info on it. http://www.observium.org/docs/tuning/