Details
-
Bug
-
Resolution: Fixed
-
 Major
-
None
-
Enterprise Edition
-
None
Description
Hello Observium Support Team,
Good afternoon.
We performed an upgrade this morning to version 26.10.15378, and afterwards we identified an issue affecting the grouped graphs displayed in our dashboards.
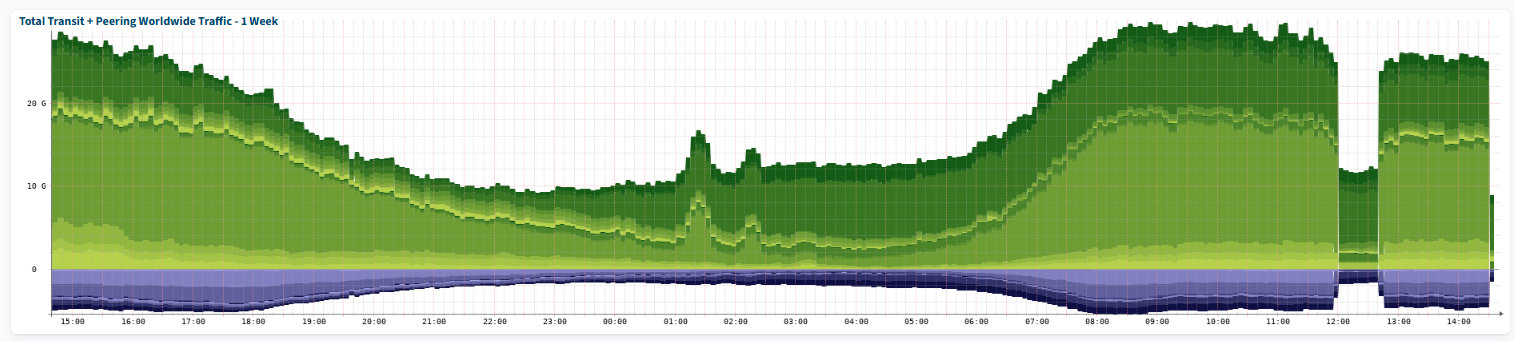
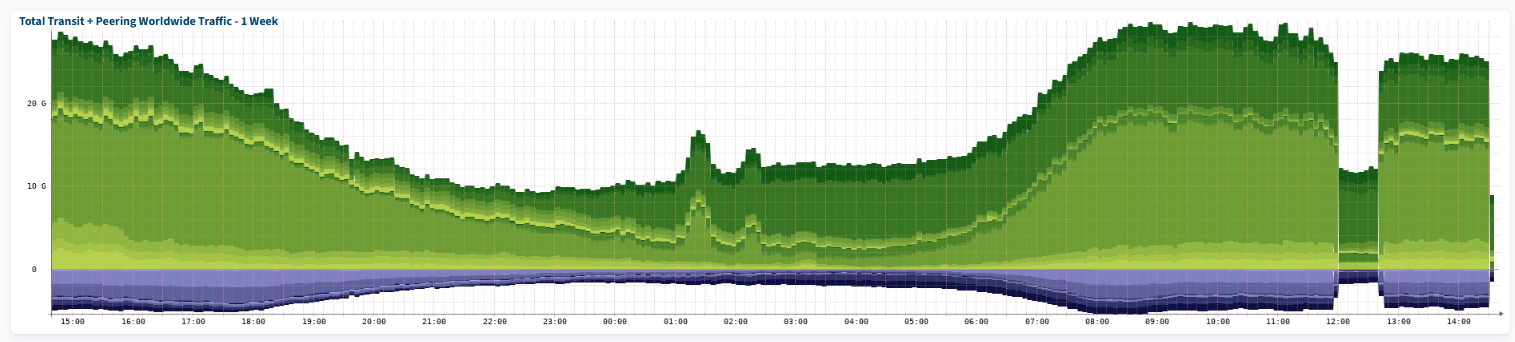
As shown in the attached screenshot, before the upgrade this dashboard widget was displaying data for the last week. After the upgrade, however, it only displays data for the last day.
We have attempted to re-add the graph to the dashboard and explicitly set the time range to 1 week, but once the graph is saved, it automatically reverts to displaying only the last day.
If we open the graph directly, we can manually change and view different time ranges without any issue. However, our requirement is for the dashboard widgets to respect and retain the configured time period (for example, 1 week, 1 month, etc.), as they did before the upgrade.
Could you please investigate whether this is a known issue related to version 26.10.15378 and advise on a possible solution or workaround?
Thank you for your assistance.
Kind regards.-