Uploaded image for project: 'Observium'
  1. Observium
  2. OBS-4959

Interface In and out graph difference

Details

    • Help
    • Resolution: Fixed
    • Critical
    • None
    • None
    • Graphs
    • None

    Description

      Hi Team,


      We switching from PRTG to observium tool for our infra monitoring.

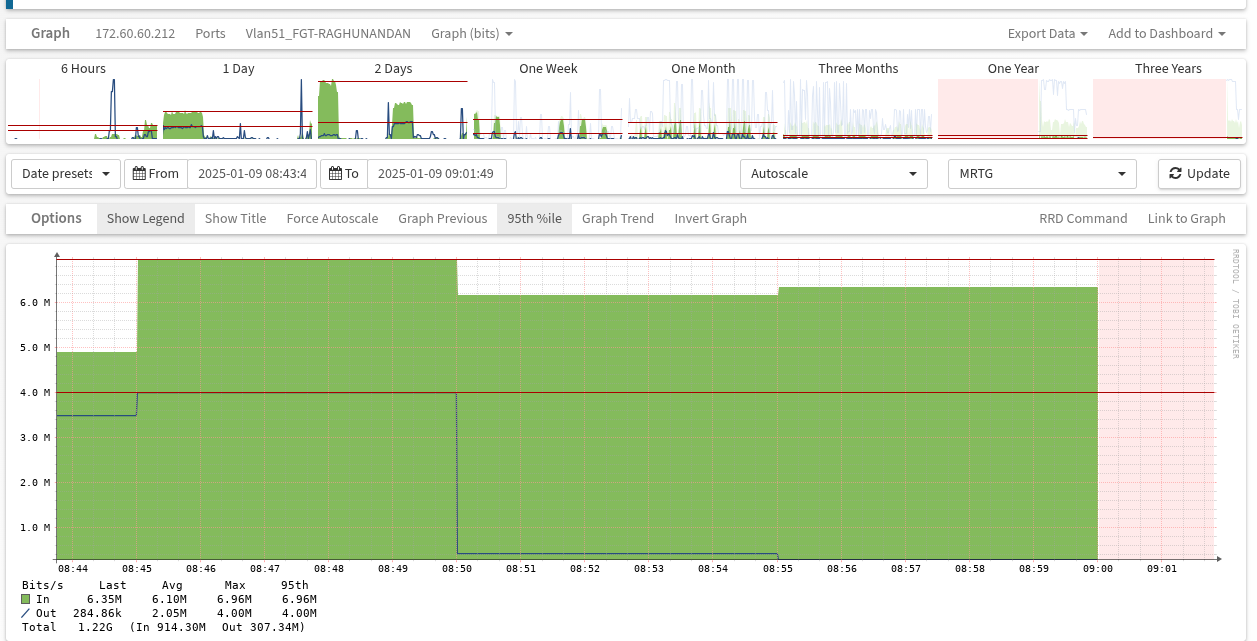
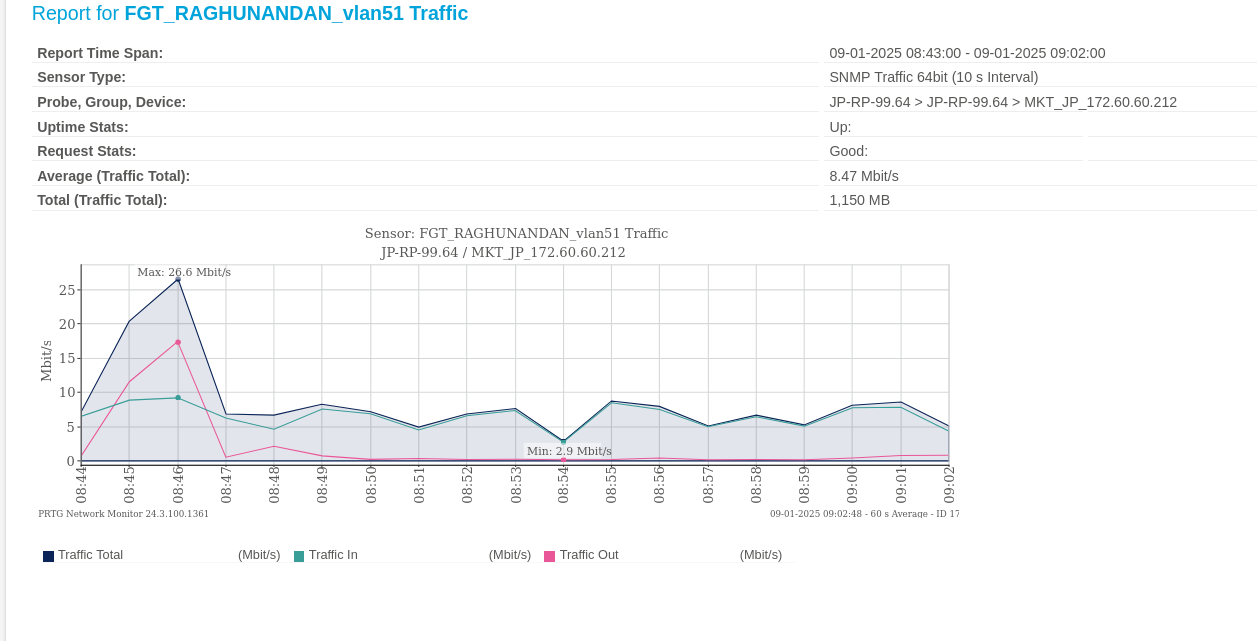
      But as i have add the some devices we observe some difference our switch port IN and Out traffic utilisation on graph in Observium compare to prtg graph


      like in prtg same switch and port showing in traffic 10M and in PRTG its show 4.8M, we have added almost 15 switches and the utilisation difference comes in all devices Graph


      Kindly help to solve this issue


      I am Attaching some snapshot of PRTG and Observium of traffic utilisation differences for your reference


      Thanks & regards

      Sawan Patel

      Attachments

        1. Discovery-php.txt
          834 kB
        2. myagent.snmpwalk
          571 kB
        3. poller-php.txt
          830 kB
        4. Screenshot from 2025-01-09 09-02-28.png
          Screenshot from 2025-01-09 09-02-28.png
          100 kB
        5. Screenshot from 2025-01-09 09-03-02.png
          Screenshot from 2025-01-09 09-03-02.png
          100 kB

        Activity

          [OBS-4959] Interface In and out graph difference

          The two platforms have different polling frequencies, so won't produce the same data.

          adama Adam Armstrong added a comment - The two platforms have different polling frequencies, so won't produce the same data.

          Hi team,


          Please find mention data which you have asked


          Discovery-php.txt

          myagent.snmpwalkpoller-php.txt

          spatel sawan patel added a comment - Hi team,   Please find mention data which you have asked   Discovery-php.txt myagent.snmpwalk poller-php.txt

          General questions and device support can be discussed in our Discord channel, click here to join.


          Please make and attach additional information about the device:

          • full snmp dump from device:

            snmpwalk -v2c -c <community> -t 3 -Cc --hexOutputLength=0 -Ih -ObentxU <hostname> .1 > myagent.snmpwalk
            snmpwalk -v2c -c <community> -t 3 -Cc --hexOutputLength=0 -Ih -ObentxU <hostname> .1.3.6.1.4.1 >> myagent.snmpwalk

            If device not support SNMP version 2c, replace -v2c with -v1.

          • If you have problems with discovery or poller processes, please do and attach these debugs:

            ./discovery.php -d -h <device>
            ./poller.php -d -h <device>

          • additionally attach device and/or vendor specific MIB files

          This comment is added automatically.

          bot Observium Bot added a comment - General questions and device support can be discussed in our Discord channel, click here to join . Please make and attach additional information about the device: full snmp dump from device: snmpwalk -v2c -c <community> -t 3 -Cc --hexOutputLength=0 -Ih -ObentxU <hostname> .1 > myagent.snmpwalk snmpwalk -v2c -c <community> -t 3 -Cc --hexOutputLength=0 -Ih -ObentxU <hostname> .1.3.6.1.4.1 >> myagent.snmpwalk If device not support SNMP version 2c, replace -v2c with -v1. If you have problems with discovery or poller processes, please do and attach these debugs: ./discovery.php -d -h <device> ./poller.php -d -h <device> additionally attach device and/or vendor specific MIB files This comment is added automatically.

          People

            adama Adam Armstrong
            spatel sawan patel
            Votes:
            0 Vote for this issue
            Watchers:
            3 Start watching this issue

            Dates

              Created:
              Updated:
              Resolved: