Details
-
Bug
-
Resolution: Unresolved
-
Minor
-
None
-
Professional Edition
-
None
Description
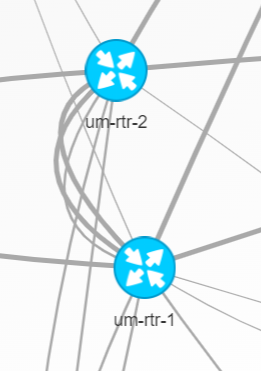
The network traffic map is amazing and proving incredibly useful for visualising the improvements we're making – but unfortuantely I'm finding it a bit unreliable in whether it displays or not.
Sometimes it works fine, but most of the time I just get a blank screen (I can see the traffic map buttons but that's it). If I maximise the browser window I get the summary status elements appearing down the left hand side, but nothing on the map section.
As far as I can tell I'm not out of resources and restarting apache doesn't do anything. According to the web inspector browser tool, every resource has a 200 status so it doesn't look like it's waiting on anything.
With the suggestion from Adam Thompson above, I was able to figure out how to solve this.
First: use developer tools / console to identify the error e.g.
Uncaught Error: Can not create edge `...` with nonexistant target `dXXX`
Second, view page source for the traffic map and search for the failing target and pull the relevant line, in my case it was
{{
{ data: \{"source":"d477","target":"d437","percent":"0","percentin":"0","percentout":"0","gradient":"#00a000 #00a000 #00a000 #00a000","colourin":"#00a000","colourout":"#00a000","popupurl":"ajax/entity_popup.php?entity_type=port&entity_id=19691"}},}}
I then went into the database and did a
select device_id,port_label from ports where port_id = '19691';
This showed me that the issue was with an ignored device that had been monitored prevously but subsequently disconnected.
After deleting this device, network traffic map now works fine.
Hopefully this can help someone else!