Details

    Description

      Hello,

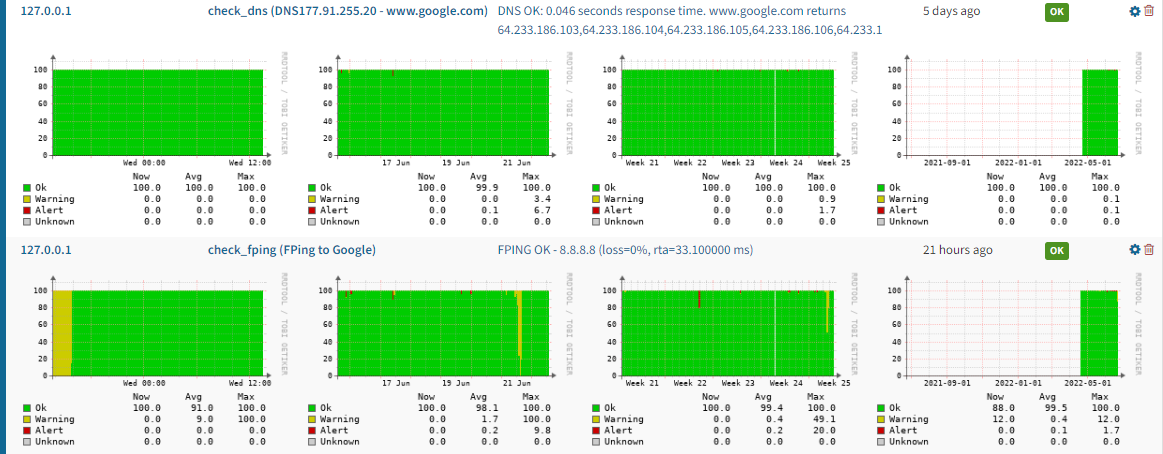
      Currently I'm using the Probes feature to check the connectivity to non-SNMP devices, it works great! But it only shows the loss percent graph, please your help to able time response graphs, it will be a big help!

      Than you in advance.

      Attachments

        1. graphs_example.png
          graphs_example.png
          222 kB
        2. output_check_dns.png
          output_check_dns.png
          12 kB
        3. output_check_fping.png
          output_check_fping.png
          9 kB

        Activity

          [OBS-4145] Add time response graph for Probes

          We don't currently have the ability to display graphs of the return data from the probes. The graphs that currently exist are showing the up/down status of the probe.

          adama Adam Armstrong added a comment - We don't currently have the ability to display graphs of the return data from the probes. The graphs that currently exist are showing the up/down status of the probe.

          Hello!

          Do you have an update about this?

          Thank you.

          ftipiani Fernando Tipiani added a comment - Hello! Do you have an update about this? Thank you.

          Hello!

          Please, let me know if you have an update.

          Thank you in advance.

          ftipiani Fernando Tipiani added a comment - Hello! Please, let me know if you have an update. Thank you in advance.

          In my case, I'm using probes from my observium server to check the connectivity to non-SNMP devices and test DNS resolution time too, but the graphs only show the loss % and it wil very helpful include a graph with the time response, for example RTA for the check_fping probes or the response_time for check_dns probes.

          Please check the  3 attached images.

          Thank you in advance.

          ftipiani Fernando Tipiani added a comment - In my case, I'm using probes from my observium server to check the connectivity to non-SNMP devices and test DNS resolution time too, but the graphs only show the loss % and it wil very helpful include a graph with the time response, for example RTA for the check_fping probes or the response_time for check_dns probes. Please check the  3 attached images. Thank you in advance.

          you mean time response by probe run or specific value from probe output?
          (just probe output for different probes is different)

          landy Mike Stupalov added a comment - you mean time response by probe run or specific value from probe output? (just probe output for different probes is different)

          Hello, do you have an update?

          Thank you in advance.

          ftipiani Fernando Tipiani added a comment - Hello, do you have an update? Thank you in advance.

          People

            landy Mike Stupalov
            ftipiani Fernando Tipiani
            Votes:
            0 Vote for this issue
            Watchers:
            4 Start watching this issue

            Dates

              Created:
              Updated: