Details
-
Help
-
Resolution: Cannot Reproduce
-
 Major
Major
-
None
-
Professional Edition
-
linux
Description
Witam wszystkich
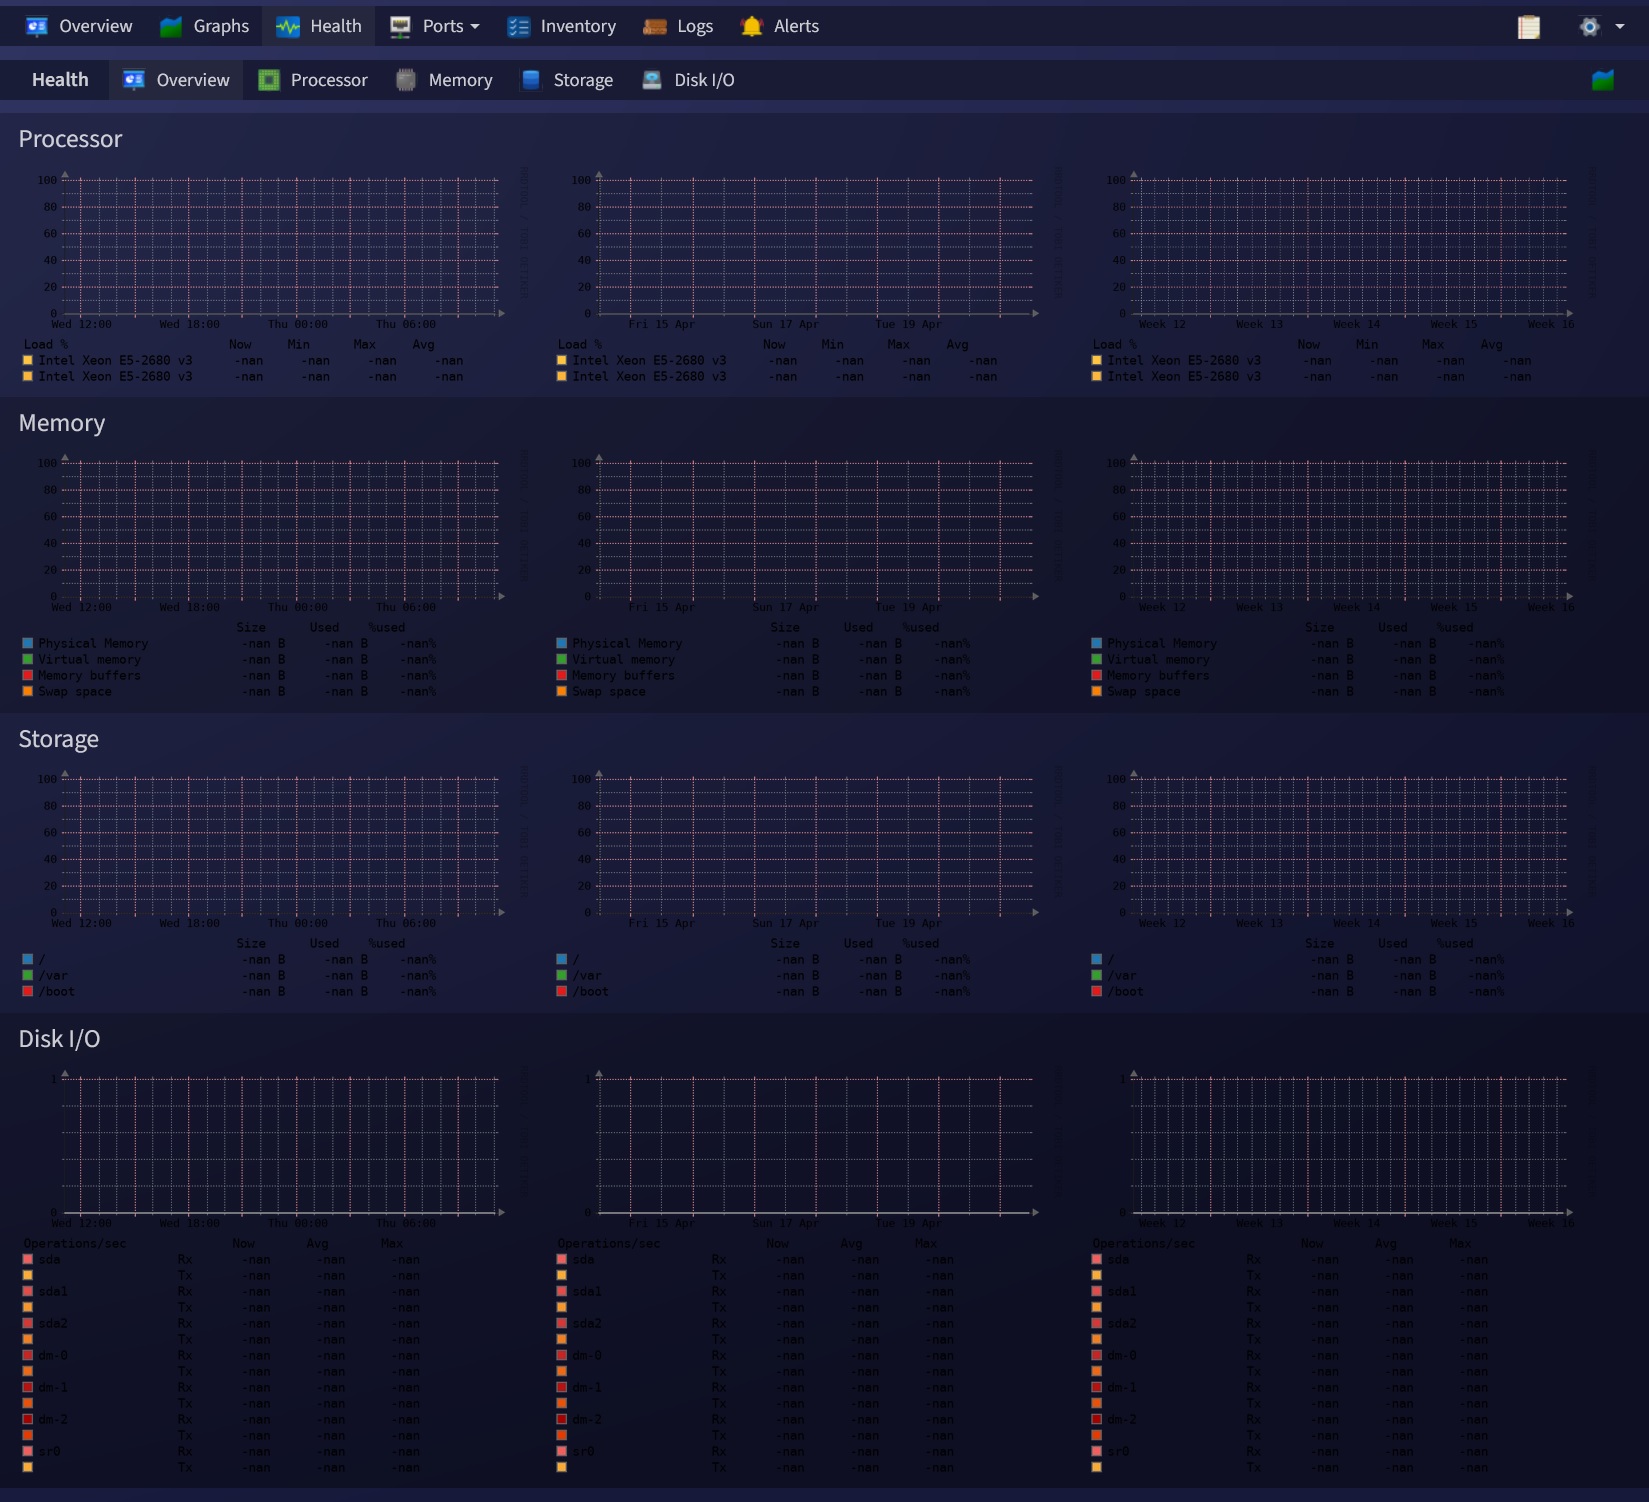
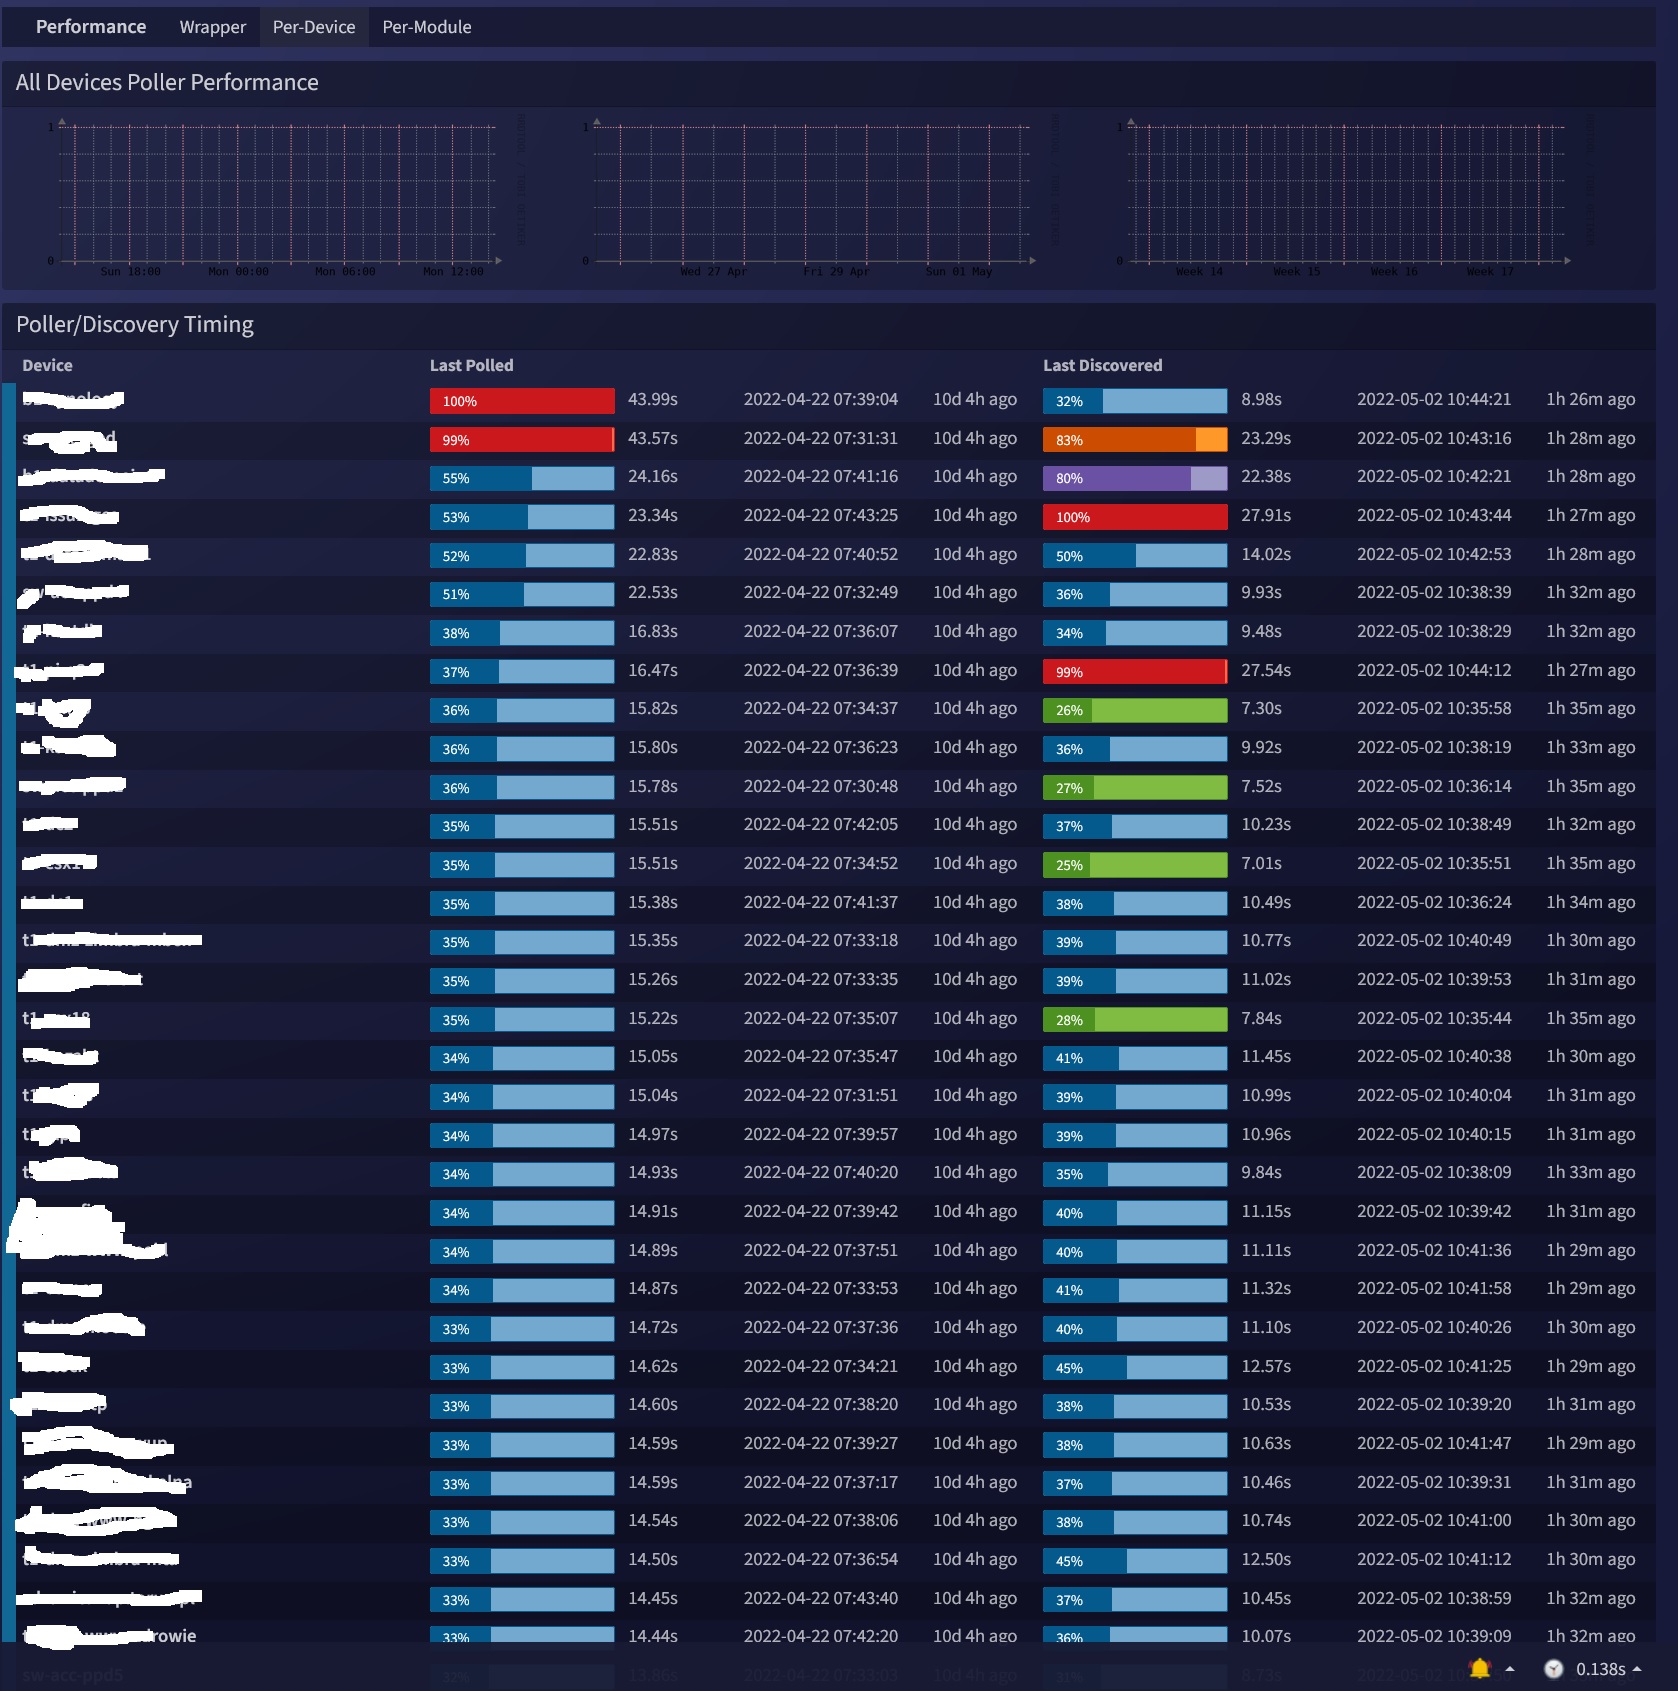
Posiadam ver. 22.2.11868 (1st February 2022) i wszystkie wykresy są puste
Proszę o pomoc
Jakie dane mam umieścić w celu diagnozy?
Attachments

Activity
I don't see logs - pollerlog ?
/]# vi /opt/observium/logs/
access_log cleanup.log db.log error_log housekeeping.log observium.log update-errors.log
vi /var/log/
anaconda/ boot.log-20220419 dmesg libvirt/ messages-20220403 secure-20220417 vmware-network.1.log vmware-vmsvc-root.3.log wtmp
audit/ btmp dmesg.old maillog messages-20220410 spooler vmware-network.2.log vmware-vmsvc-root.4.log yum.log
boot.log btmp-20220401 firewalld maillog-20220327 messages-20220417 spooler-20220327 vmware-network.3.log vmware-vmsvc-root.5.log yum.log-20200101
boot.log-20211221 clamav/ freshclam.log maillog-20220403 ntpstats/ spooler-20220403 vmware-network.log vmware-vmsvc-root.6.log yum.log-20201117
boot.log-20220118 cron glusterfs/ maillog-20220410 ppp/ spooler-20220410 vmware-vgauthsvc.log.0 vmware-vmsvc-root.7.log yum.log-20210101
boot.log-20220222 cron-20220327 grubby maillog-20220417 secure spooler-20220417 vmware-vmsvc.log vmware-vmsvc-root.8.log yum.log-20220101
boot.log-20220311 cron-20220403 grubby_prune_debug mariadb/ secure-20220327 swtpm/ vmware-vmsvc-root.10.log vmware-vmsvc-root.9.log
boot.log-20220322 cron-20220410 httpd/ messages secure-20220403 tallylog vmware-vmsvc-root.1.log vmware-vmsvc-root.log
boot.log-20220408 cron-20220417 lastlog messages-20220327 secure-20220410 tuned/ vmware-vmsvc-root.2.log vmware-vmtoolsd-root.log
SQL RUNTIME[0.00192595s]
RRD /opt/observium/rrd/proooooofer/alert-4986.rrd already exists - no need to create.
RRD CMD[update /opt/observium/rrd/proooooofer/alert-4986.rrd N:1:1]
RRD RUNTIME[0.0011s]
RRD STDOUT[OK u:0.01 s:0.01 r:0.23]
RRD_STATUS[TRUE]
___ _ _
/ _ \ | |__ ___ ___ _ __ __ _() _ _ _ __ ___
| '_ \ / __ | / _ | '__ | \ \ / / | '_ ` _ \ | |||||||||||||
|---|---|---|---|---|---|---|---|---|---|---|---|---|---|---|---|---|
| _ | _) | __ | __/ | \ V / | _ |
__/ |._/ |_/ _||| _/ || _,||| || ||
Observium Professional 22.2.11868
https://www.observium.org
There is a newer revision of Observium available!
Version 22.4.11952 (22nd April 2022) is 84 revisions ahead.
-
-
-
-
- Starting polling run at 2022-04-22 06:28:03 #####
-
-
-
##### proooooofer [156] #####
o OS windows
o Last poll duration 2.99 seconds
o Last Polled 2022-04-21 09:08:39
o SNMP Version v2c
o Device status Device is reachable by PING (1.13ms) and SNMP (37.55ms)
-
-
-
-
- Module Start: system #####
-
-
-
o SNMPv2-MIB
o Uptime 3 days, 11h 27m 28s
o Last reboot 2022-04-18 19:00:36
o sysObjectID .1.3.6.1.4.1.311.1.1.3.1.2
o snmpEngineID
o sysDescr Hardware: Intel64 Family 6 Model 63 Stepping 2 AT/AT COMPATIBLE - Software: Windows Version 6.3 (Build 14393 Multiprocessor
Free)
o sysName proooooofer.domena.local
o Location Tor
o Module time 0.1882s
-
-
-
-
- Module Start: os #####
-
-
-
o OS Poller OS
o Type Servers
o Vendor <empty>
o Hardware Intel x64
o Version Server 2016 (NT 6.3)
o Features Multiprocessor
o Serial <empty>
o Asset <empty>
o Module time 0.0056s
-
-
-
-
- t1-profilmaster [156] completed poller modules at 2022-04-22 06:28:03 #####
-
-
-
o Graphs [checked] availability, ping, ping_snmp, uptime
o Poller time 0.2556 seconds
o Updated Data uptime, last_polled, last_polled_timetaken
-
-
-
-
- Completed polling run at 2022-04-22 06:28:03 #####
-
-
-
o Devices Polled 1
o Poller Time 0.271 secs
o Memory usage 20MB (peak: 20MB)
o MySQL Usage Insert[1/0.002s] Update[6/0.012s] Delete[1/0.002s] Cell[3/0.001s] Row[10/0.006s] Rows[9/0.008s] Col[1/0s]
Connect[1/0.004s](0.035s 13.069%)
o RRDTool Usage update[5/0.006s] (0.006s 2.086%)
o SNMP Usage snmpget[8/0.189s] errors[/0s] (0.189s 69.85%)
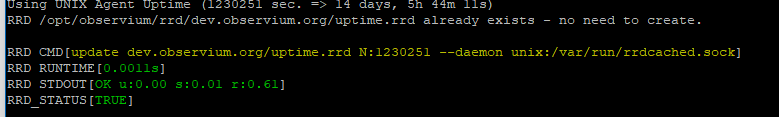
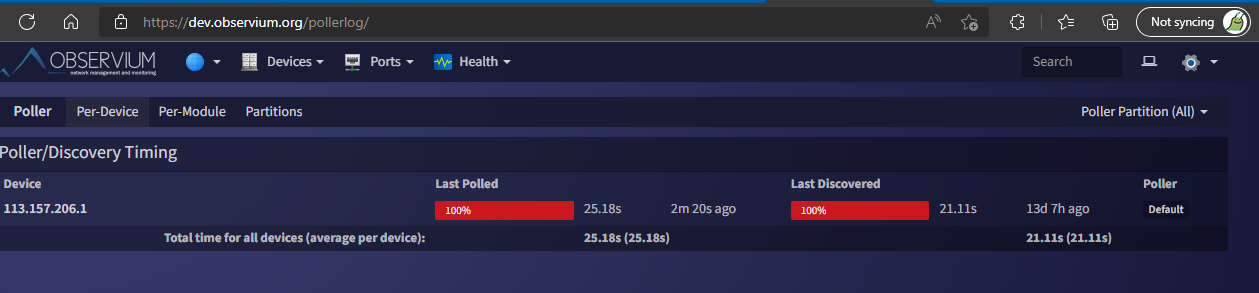
This is most likely permissions (if the poller is successfully running and you can see the last polled times in the /pollerlog/ page).
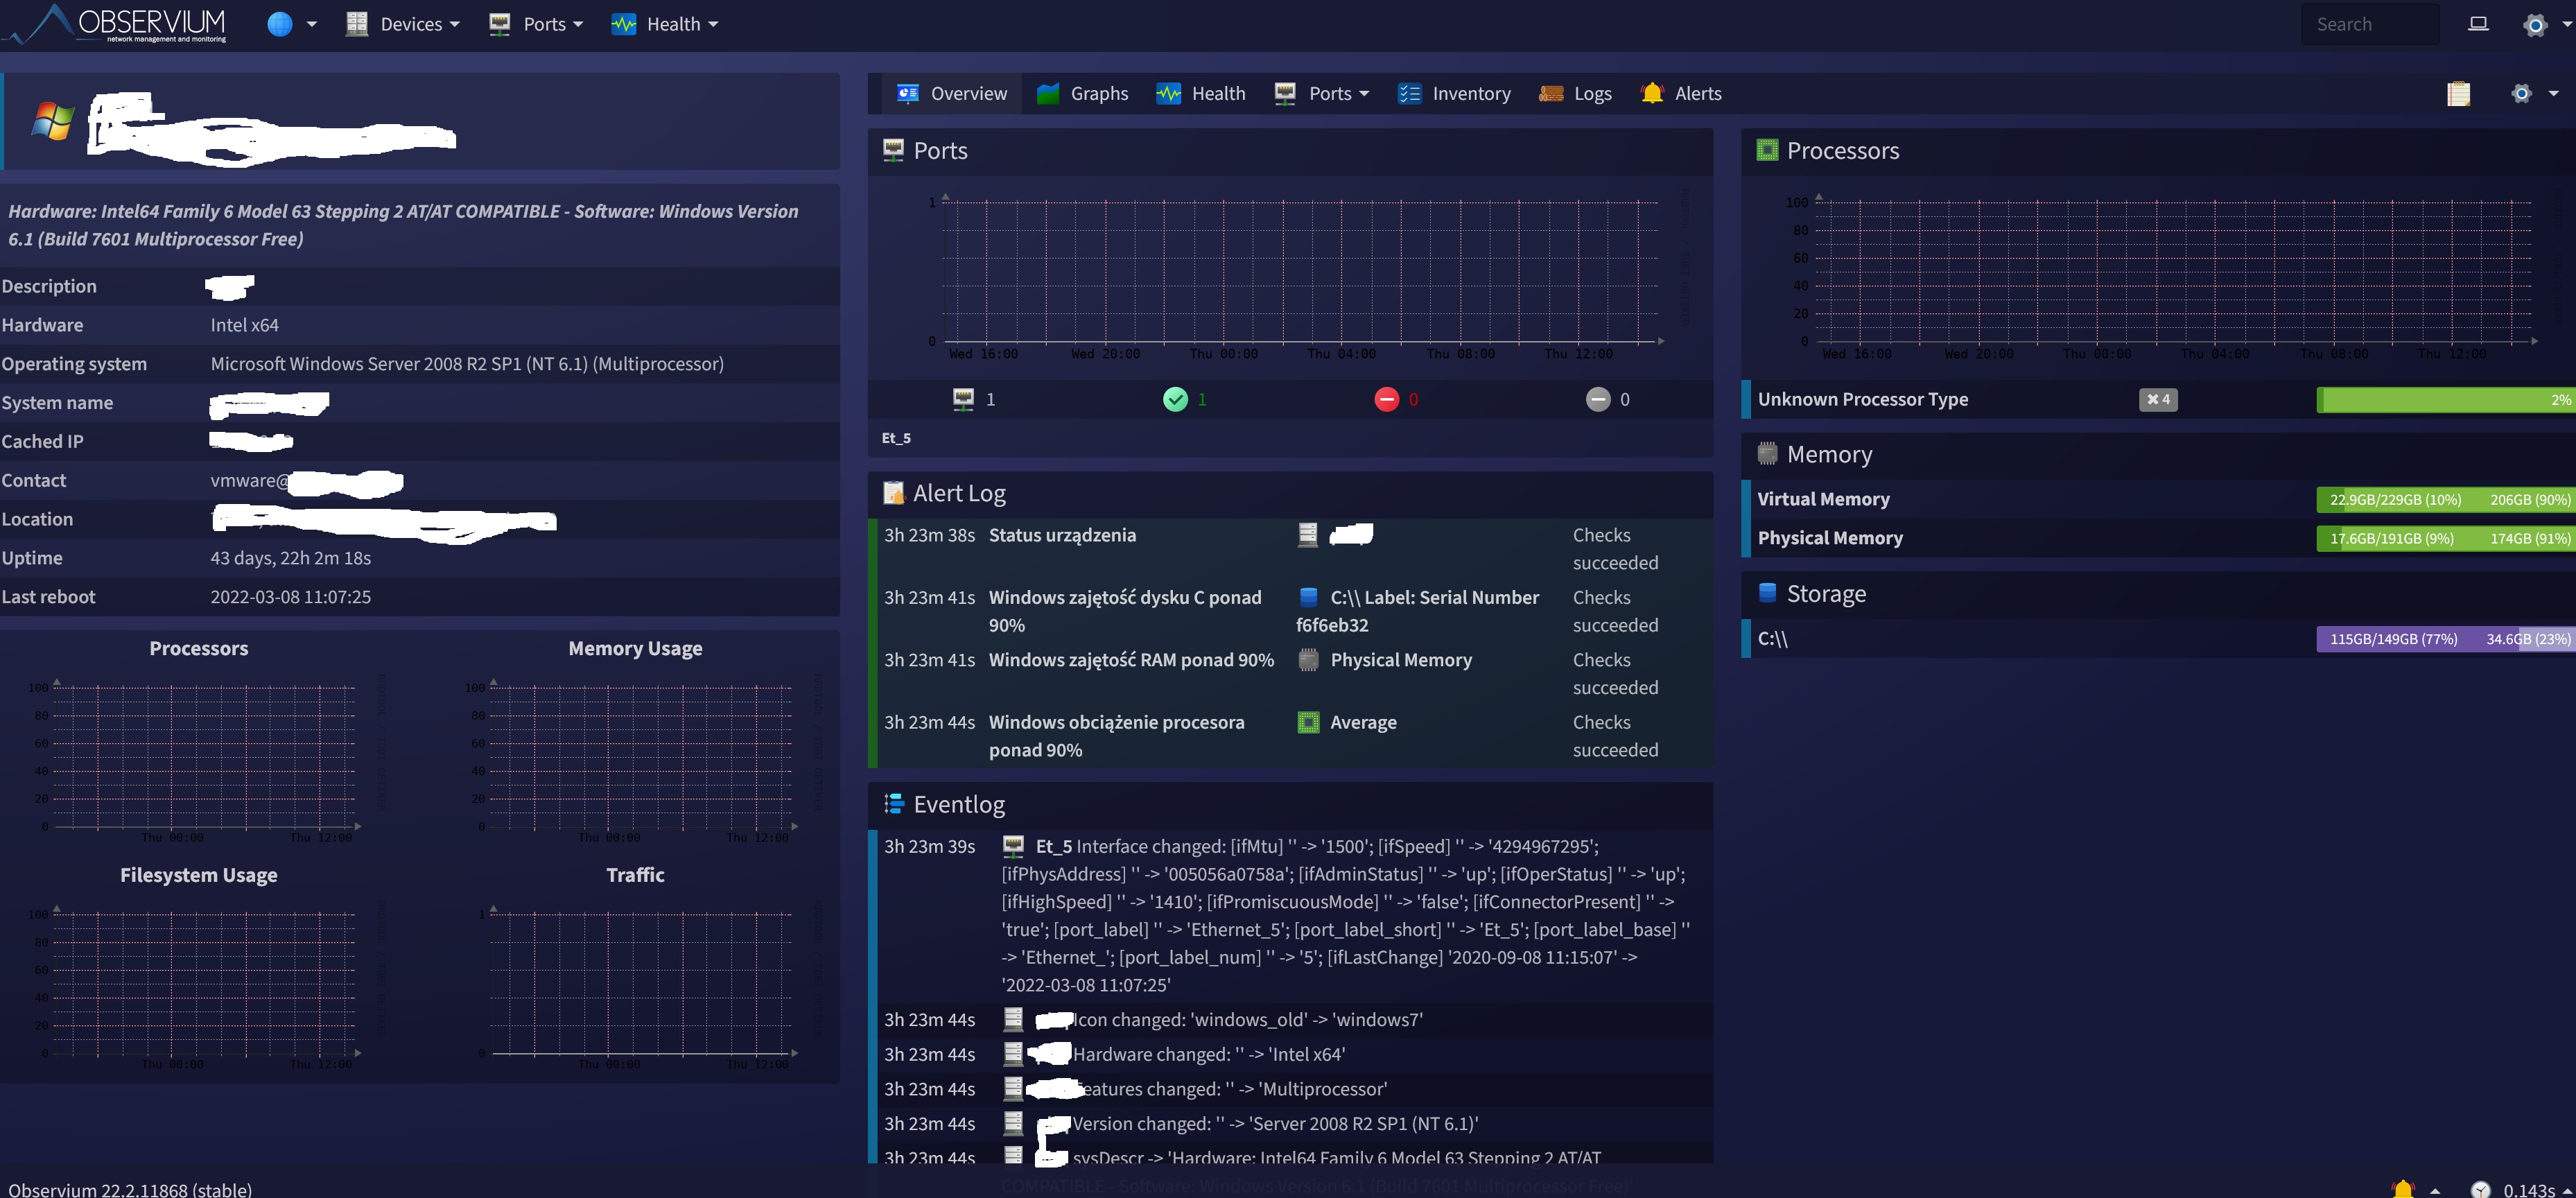
You should see sections like this in the ./poller.php -h <device_id> -m system -d output:

If it's failing to write the RRDs you should see an error. If it's a permissions issue, you need to change the ownership to match the user that the poller runs as. On an install script installation this would be something like:
chown -R observium.observium /opt/observium/rrd
If the poller isn't being run (i.e. the /pollerlog/ shows last polled times more than 5 minutes ago), you should check that the poller-wrapper.py executes correctly on your system.

as minimum poller debug:
./poller.php -d -h <device>
|
Also read FAQ:
https://docs.observium.org/faq/#all-my-hosts-seem-down-to-observium-snmp-doesnt-seem-to-work-anymore
Hello everyone
I have ver. 22.2.11868 (1st February 2022) and all charts are blank
Please help
What data should I put in for diagnosis?
General questions and device support can be discussed in our Discord channel, click here to join.
Please make and attach additional information about the device:
- full snmp dump from device:
snmpwalk -v2c -c <community> -t 3 -Cc --hexOutputLength=0 -ObentxU <hostname> .1 > myagent.snmpwalksnmpwalk -v2c -c <community> -t 3 -Cc --hexOutputLength=0 -ObentxU <hostname> .1.3.6.1.4.1 >> myagent.snmpwalkIf device not support SNMP version 2c, replace -v2c with -v1.
- If you have problems with discovery or poller processes, please do and attach these debugs:
./discovery.php -d -h <device>./poller.php -d -h <device>
- additionally attach device and/or vendor specific MIB files
This comment is added automatically.
i don't have user observium
ls -halF /opt/observium/rrd/zdrowie.wup.torun.pl/
total 30M
drwxr-xr-x 2 apache apache 4.0K Apr 7 14:13 ./
drwxr-xr-x. 162 apache apache 4.0K Apr 21 11:09 ../
rw-rr- 1 apache apache 228K Apr 21 11:11 alert-5099.rrdrw-rr- 1 apache apache 228K Apr 21 11:11 alert-5100.rrdrw-rr- 1 apache apache 228K Apr 21 11:11 alert-5101.rrdrw-rr- 1 apache apache 228K Apr 21 11:11 alert-5102.rrdrw-rr- 1 apache apache 228K Apr 21 11:11 alert-5117.rrdrw-rr- 1 apache apache 115K Apr 21 11:11 hr_processes.rrdrw-rr- 1 apache apache 115K Apr 21 11:11 hr_users.rrdrw-rr- 1 apache apache 1.8M Apr 21 11:11 ipSystemStats-ipv4.rrdrw-rr- 1 apache apache 1.8M Apr 21 11:11 ipSystemStats-ipv6.rrdrw-rr- 1 apache apache 341K Apr 21 11:11 la.rrdrw-rr- 1 apache apache 228K Apr 21 11:11 mempool-host-resources-mib--10.rrdrw-rr- 1 apache apache 228K Apr 21 11:11 mempool-host-resources-mib--3.rrdrw-rr- 1 apache apache 228K Apr 21 11:11 mempool-host-resources-mib--6.rrdrw-rr- 1 apache apache 228K Apr 21 11:11 mempool-ucd-snmp-mib--0.rrdrw-rr- 1 apache apache 2.9M Apr 21 11:11 netstats-icmp.rrdrw-rr- 1 apache apache 1.8M Apr 21 11:11 netstats-ip.rrdrw-rr- 1 apache apache 3.3M Apr 21 11:11 netstats-snmp.rrdrw-rr- 1 apache apache 1.2M Apr 21 11:11 netstats-tcp.rrdrw-rr- 1 apache apache 454K Apr 21 11:11 netstats-udp.rrdrw-rr- 1 apache apache 115K Apr 21 11:11 perf-pollermodule-applications.rrdrw-rr- 1 apache apache 115K Apr 21 11:11 perf-pollermodule-bgp-peers.rrdrw-rr- 1 apache apache 115K Apr 21 11:11 perf-pollermodule-counter.rrdrw-rr- 1 apache apache 115K Apr 21 11:11 perf-pollermodule-entity-physical.rrdrw-rr- 1 apache apache 115K Apr 21 11:11 perf-pollermodule-fdb-table.rrdrw-rr- 1 apache apache 115K Apr 21 11:11 perf-pollermodule-graphs.rrdrw-rr- 1 apache apache 115K Apr 21 11:11 perf-pollermodule-ipmi.rrdrw-rr- 1 apache apache 115K Apr 21 11:11 perf-pollermodule-ipSystemStats.rrdrw-rr- 1 apache apache 115K Apr 21 11:11 perf-pollermodule-loadbalancer.rrdrw-rr- 1 apache apache 115K Apr 21 11:11 perf-pollermodule-mac-accounting.rrdrw-rr- 1 apache apache 115K Apr 21 11:11 perf-pollermodule-mempools.rrdrw-rr- 1 apache apache 115K Apr 21 11:11 perf-pollermodule-netstats.rrdrw-rr- 1 apache apache 115K Apr 21 11:11 perf-pollermodule-oids.rrdrw-rr- 1 apache apache 115K Apr 21 11:11 perf-pollermodule-ospf.rrdrw-rr- 1 apache apache 115K Apr 21 11:11 perf-pollermodule-os.rrdrw-rr- 1 apache apache 115K Apr 21 11:11 perf-pollermodule-p2p-radios.rrdrw-rr- 1 apache apache 115K Apr 21 11:11 perf-pollermodule-ports.rrdrw-rr- 1 apache apache 115K Apr 21 11:11 perf-pollermodule-printersupplies.rrdrw-rr- 1 apache apache 115K Apr 21 11:11 perf-pollermodule-probes.rrdrw-rr- 1 apache apache 115K Apr 21 11:11 perf-pollermodule-processors.rrdrw-rr- 1 apache apache 115K Apr 21 11:11 perf-pollermodule-pseudowires.rrdrw-rr- 1 apache apache 115K Apr 21 11:11 perf-pollermodule-sensors.rrdrw-rr- 1 apache apache 115K Apr 21 11:11 perf-pollermodule-sla.rrdrw-rr- 1 apache apache 115K Apr 21 11:11 perf-pollermodule-status.rrdrw-rr- 1 apache apache 115K Apr 21 11:11 perf-pollermodule-storage.rrdrw-rr- 1 apache apache 115K Apr 21 11:11 perf-pollermodule-system.rrdrw-rr- 1 apache apache 115K Apr 21 11:11 perf-pollermodule-ucd-diskio.rrdrw-rr- 1 apache apache 115K Apr 21 11:11 perf-pollermodule-ucd-mib.rrdrw-rr- 1 apache apache 115K Apr 21 11:11 perf-pollermodule-unix-agent.rrdrw-rr- 1 apache apache 115K Apr 21 11:11 perf-poller.rrdrw-rr- 1 apache apache 115K Apr 21 11:11 ping.rrdrw-rr- 1 apache apache 115K Apr 21 11:11 ping_snmp.rrdrw-rr- 1 apache apache 1.5M Apr 21 11:11 port-2-dot3.rrdrw-rr- 1 apache apache 228K Apr 21 11:11 port-2-ipv6-octets.rrdrw-rr- 1 apache apache 1.7M Apr 21 11:11 port-2.rrdrw-rr- 1 apache apache 115K Apr 21 11:11 processor-hr-196608.rrdrw-rr- 1 apache apache 115K Apr 21 11:11 processor-hr-196609.rrdrw-rr- 1 apache apache 115K Apr 21 11:11 processor-hr-average-1.rrdrw-rr- 1 apache apache 115K Apr 21 11:11 status.rrdrw-rr- 1 apache apache 228K Apr 21 11:11 storage-host-resources-mib-_boot.rrdrw-rr- 1 apache apache 228K Apr 21 11:11 storage-host-resources-mib-_.rrdrw-rr- 1 apache apache 228K Apr 21 11:11 storage-host-resources-mib-_var.rrdrw-rr- 1 apache apache 454K Apr 21 11:11 ucd_cpu.rrdrw-rr- 1 apache apache 454K Apr 21 11:11 ucd_diskio-dm-0.rrdrw-rr- 1 apache apache 454K Apr 21 11:11 ucd_diskio-dm-1.rrdrw-rr- 1 apache apache 454K Apr 21 11:11 ucd_diskio-dm-2.rrdrw-rr- 1 apache apache 454K Apr 21 11:11 ucd_diskio-sda1.rrdrw-rr- 1 apache apache 454K Apr 21 11:11 ucd_diskio-sda2.rrdrw-rr- 1 apache apache 454K Apr 21 11:11 ucd_diskio-sda.rrdrw-rr- 1 apache apache 454K Apr 21 11:11 ucd_diskio-sr0.rrdrw-rr- 1 apache apache 907K Apr 21 11:11 ucd_mem.rrdrw-rr- 1 apache apache 115K Apr 21 11:11 ucd_ssCpuRawIdle.rrdrw-rr- 1 apache apache 115K Apr 21 11:11 ucd_ssCpuRawInterrupt.rrdrw-rr- 1 apache apache 115K Apr 21 11:11 ucd_ssCpuRawKernel.rrdrw-rr- 1 apache apache 115K Apr 21 11:11 ucd_ssCpuRawNice.rrdrw-rr- 1 apache apache 115K Apr 21 11:11 ucd_ssCpuRawSoftIRQ.rrdrw-rr- 1 apache apache 115K Apr 21 11:11 ucd_ssCpuRawSystem.rrdrw-rr- 1 apache apache 115K Apr 21 11:11 ucd_ssCpuRawUser.rrdrw-rr- 1 apache apache 115K Apr 21 11:11 ucd_ssCpuRawWait.rrdrw-rr- 1 apache apache 115K Apr 21 11:11 ucd_ssIORawReceived.rrdrw-rr- 1 apache apache 115K Apr 21 11:11 ucd_ssIORawSent.rrdrw-rr- 1 apache apache 115K Apr 21 11:11 ucd_ssRawContexts.rrdrw-rr- 1 apache apache 115K Apr 21 11:11 ucd_ssRawInterrupts.rrdrw-rr- 1 apache apache 115K Apr 21 11:11 ucd_ssRawSwapIn.rrdrw-rr- 1 apache apache 115K Apr 21 11:11 ucd_ssRawSwapOut.rrdrw-rr- 1 apache apache 115K Apr 21 11:11 uptime.rrd