Description
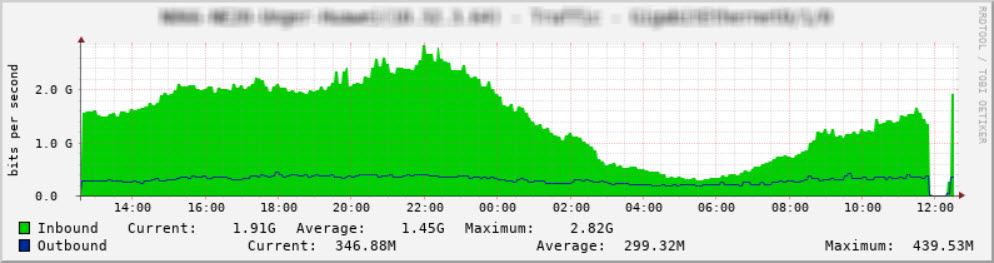
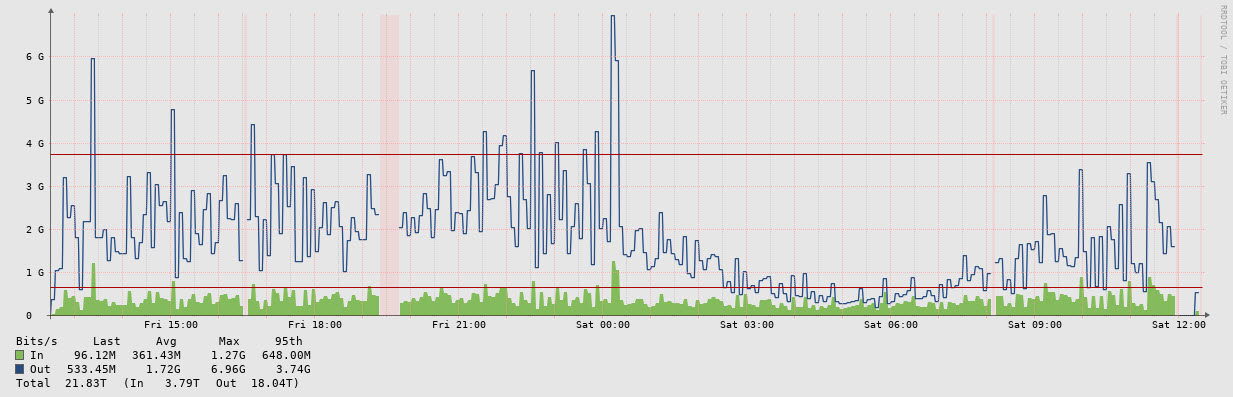
Hello, some graphs display incorrect values, it shows values greater than the reality (weird peaks for example). I compare observium´s graph with cacti and cacti show stable graph. Keepin mind this happen with some graphs. Let me know if you need additional information. Thank you in advance for your support.