Details

    • Bug
    • Resolution: Unresolved
    • Trivial
    • None
    • Professional Edition
    • Ports

    Description

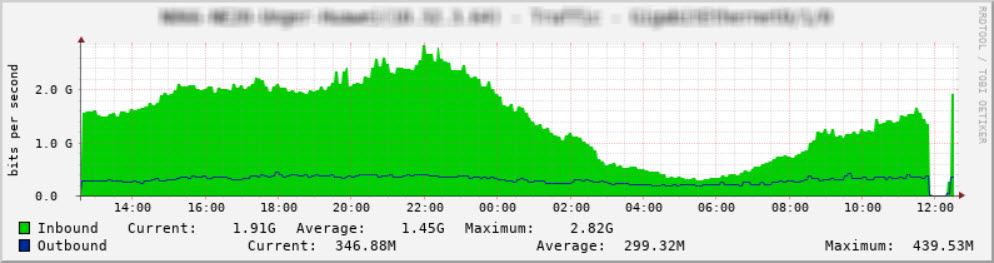
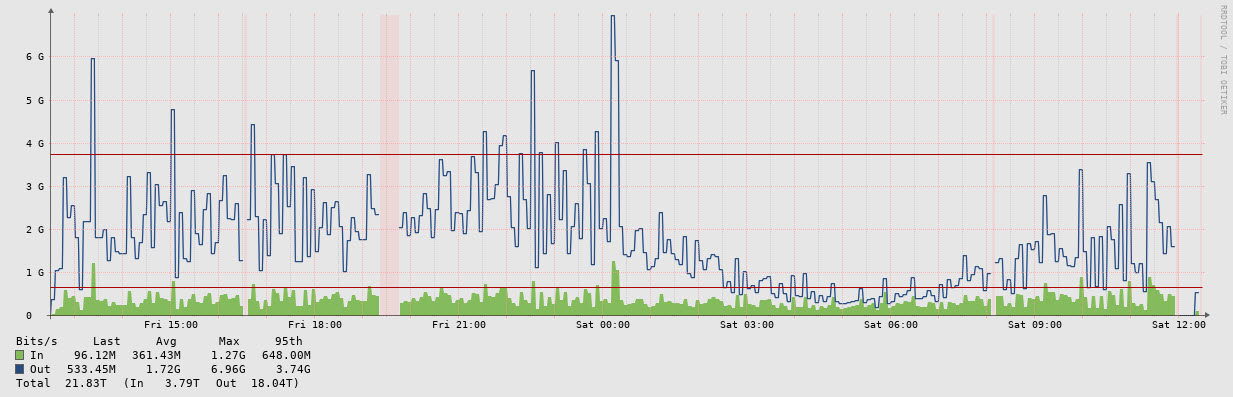
      Hello, some graphs display incorrect values, it shows values greater than the reality (weird peaks for example). I compare observium“s graph with cacti and cacti show stable graph. Keepin mind this happen with some graphs. Let me know if you need additional information. Thank you in advance for your support.

      Attachments

        Activity

          [OBS-3705] Some graphs show incorrect values

          This looks like very unstable snmpwalk times, probably this device has a very poor snmp stack or overloaded control plane.

          You can try switching to the "separate walk" ports poller mode on this device.

          This is a pretty complex set of issues, and usually is just for you to resolve within your network and specific devices.

          adama Adam Armstrong added a comment - This looks like very unstable snmpwalk times, probably this device has a very poor snmp stack or overloaded control plane. You can try switching to the "separate walk" ports poller mode on this device. This is a pretty complex set of issues, and usually is just for you to resolve within your network and specific devices.

          People

            adama Adam Armstrong
            ftipiani Fernando Tipiani
            Votes:
            0 Vote for this issue
            Watchers:
            3 Start watching this issue

            Dates

              Created:
              Updated: