Details
-
Help
-
Resolution: Not A Bug
-
Minor
-
None
-
Professional Edition
Description
Good morning.
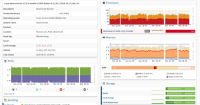
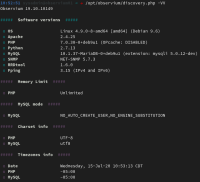
I am presenting detail in the observium the monitoring graphs are cut, in the processor it sees that it increases up to 98% on occasions. We execute the recommendations of the portal to have better performance but this detail continues to be presented. we currently have 2462 devices with all their sensors. In general the platform has been operating correctly until a couple of weeks ago. In which these cuts are presented.
Statistics DB size 1.57GB
RRD size 105GB
Devices 2462
Ports 24020
IPv4 Addresses 9253
IPv4 Networks 4710
Processors 6370
Memory pools 1808
Storage Entries 1683
Disk I/O Entries 59
HR-MIB Entries 4665
Entity-MIB Entries 5461
Eventlog Entries 2746992
Sensors 7864


