Uploaded image for project: 'Observium'
  1. Observium
  2. OBS-3053

IP SLA Graphs Missing Data

    XMLWordPrintable

Details

    • Vendor Bug
    • Resolution: Won't Fix
    • Minor
    • None
    • Professional Edition
    • None

    Description

      We are looking at using Cisco IP SLA monitors and using the graphs in Observium to display the data. The issue is we have configured Cisco path-jitter IP SLA in the router which shows RTT, Jitter, and Packet Loss from the router CLI. Example output below.


      IPSLA operation id: 200
      Latest RTT: 274 milliseconds
      Latest operation start time: 17:19:41 MDT Thu Jul 11 2019
      Latest operation return code: OK

      ---- Path Jitter Statistics ----

      Hop IP 10.16.254.255:
      Round Trip Time milliseconds:
      Latest RTT: 274 ms
      Number of RTT: 100
      RTT Min/Avg/Max: 272/274/307 ms
      Jitter time milliseconds:
      Number of jitter: 65
      Jitter Min/Avg/Max: 1/4/32 ms
      Packet Values:
      Packet Loss (Timeouts): 0
      Out of Sequence: 0
      Discarded Samples: 0


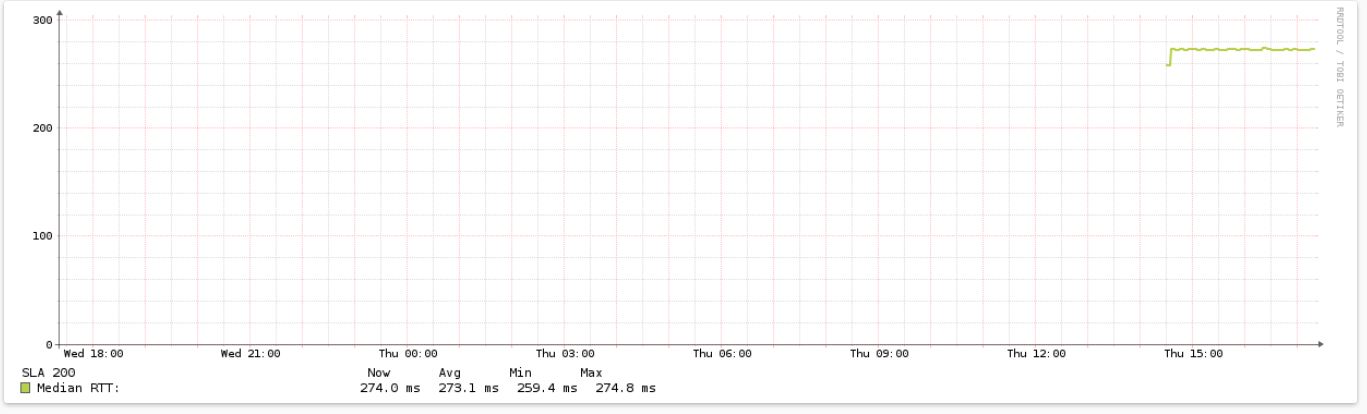
      The issue we have is the graph for the IP SLA in observium only graphs the RTT value and not the jitter or packet loss value.


      I have attached a picture of the graph from the IP SLA page in Observium for the same IP SLA operation as the text example above.

      Attachments

        1. discovery.txt
          979 kB
        2. image-2019-07-12-16-40-24-517.png
          image-2019-07-12-16-40-24-517.png
          2 kB
        3. IP_SLA.JPG
          IP_SLA.JPG
          60 kB
        4. myagent.snmpwalk
          4.95 MB
        5. poller.txt
          1.15 MB

        Activity

          People

            landy Mike Stupalov
            ajackson Andy Jackson
            Votes:
            0 Vote for this issue
            Watchers:
            2 Start watching this issue

            Dates

              Created:
              Updated:
              Resolved: