Details

    • Bug
    • Resolution: Incomplete
    • Minor
    • None
    • None
    • Poller
    • Juniper MX -104 on Cacti & Observium

    Description

      Hi Sir;

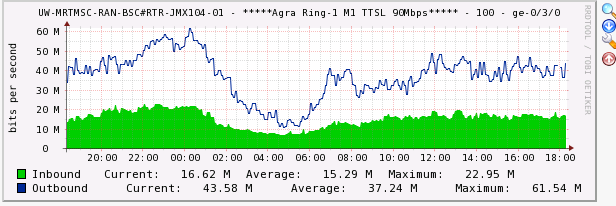
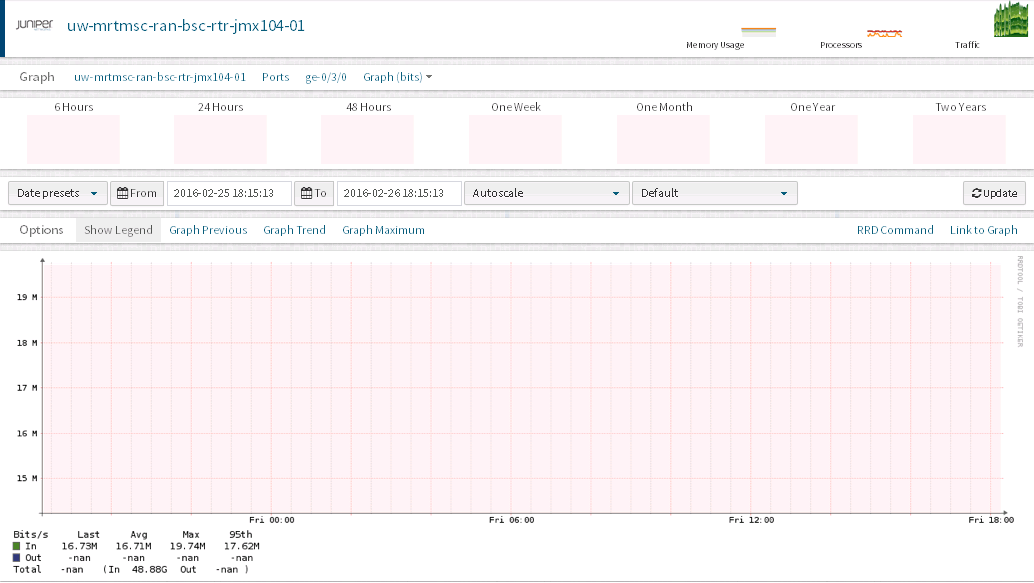
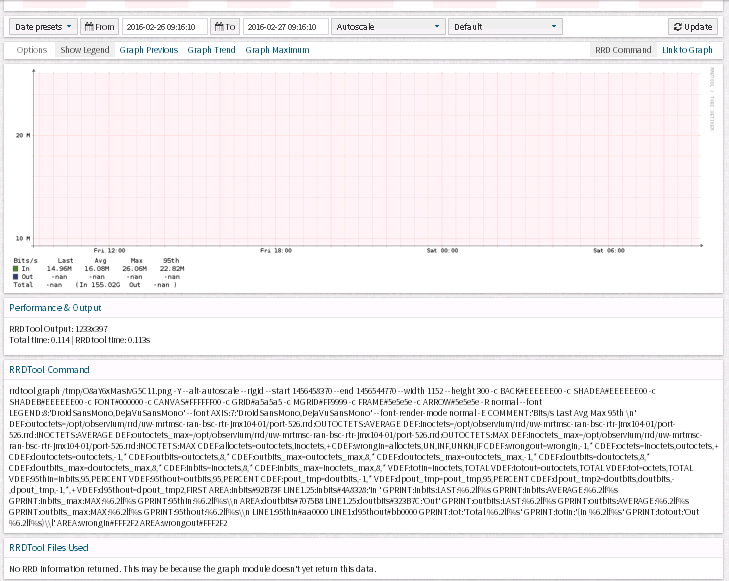
      I am using Cacti (Attached) & Observium(Attached) for MRTG.When i am checking at cacti same port/device showing IN/OUT value whereas Observium is showing Out Value as "nan" and not graphs getting plotted for any interface.

      Help know any thing specific required from my end to resolve issue

      BR+
      Rakesh

      Attachments

        1. Cacti.PNG
          Cacti.PNG
          27 kB
        2. Discovery.PNG
          Discovery.PNG
          28 kB
        3. Observium.PNG
          Observium.PNG
          71 kB
        4. Poller.rar
          73 kB
        5. putty_Debug.rar
          322 kB
        6. RRD_Command.PNG
          RRD_Command.PNG
          59 kB
        7. SNMP_time_Change.rar
          125 kB
        8. SNMP Errors.PNG
          SNMP Errors.PNG
          52 kB

        Activity

          [OBS-1727] JUNOS showing MRTG Out Value as nan
          landy Mike Stupalov made changes -
          Status Original: Resolved [ 5 ] New: Closed [ 6 ]
          landy Mike Stupalov made changes -
          Resolution New: Incomplete [ 4 ]
          Status Original: Pending Response [ 10000 ] New: Resolved [ 5 ]

          Fixed or not actual for user anymore.

          landy Mike Stupalov added a comment - Fixed or not actual for user anymore.
          landy Mike Stupalov made changes -
          Status Original: Open [ 1 ] New: Pending Response [ 10000 ]
          landy Mike Stupalov made changes -
          Workflow Original: classic default workflow [ 12832 ] New: Observium workflow [ 13160 ]
          landy Mike Stupalov made changes -
          Labels New: ports
          landy Mike Stupalov made changes -
          Priority Original: Major [ 3 ] New: Minor [ 4 ]
          landy Mike Stupalov made changes -
          Component/s New: Poller [ 10000 ]

          Please try new experimental option, especially for such case:
          1. update your observium to latest rolling (svn up)
          2. goto page: Device -> Properties -> Modules
          3. Enable ports module: "separate_walk"
          4. create and attach new polling debug output ./poller.php -d -m ports -h <your_device>

          landy Mike Stupalov added a comment - Please try new experimental option, especially for such case: 1. update your observium to latest rolling (svn up) 2. goto page: Device -> Properties -> Modules 3. Enable ports module: "separate_walk" 4. create and attach new polling debug output ./poller.php -d -m ports -h <your_device>

          This is caused by your devices failing to correctly complete an snmpwalk operation. Since we didn't create your devices and we don't run your network, this isn't really anything we can fix.

          adama Adam Armstrong added a comment - This is caused by your devices failing to correctly complete an snmpwalk operation. Since we didn't create your devices and we don't run your network, this isn't really anything we can fix.

          People

            landy Mike Stupalov
            vyas Rakesh
            Votes:
            0 Vote for this issue
            Watchers:
            3 Start watching this issue

            Dates

              Created:
              Updated:
              Resolved: