Details
-
Bug
-
Resolution: Incomplete
-
Minor
-
None
-
None
-
Observium CE 0.14.4.5229
Apache 2.4.7 (Ubuntu)
PHP 5.5.9-1ubuntu4.4
MySQL 5.5.40-0ubuntu0.14.04.1
SNMP NET-SNMP version: 5.7.2
RRDtool 1.4.7
Description
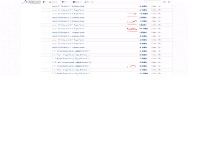
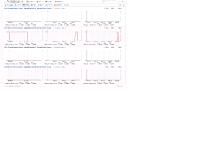
As show in the screenshot i don´t get any dbm graphs on some interfaces even as you can see there is a value polled. For example i can have this problem on host X on interface Gi0/1 it works but not on Gi1/1 but both of the interfaces displays a valid value.
A show interface transceiver detail displays the following
Optical High Alarm High Warn Low Warn Low Alarm
Transmit Power Threshold Threshold Threshold Threshold
Port (dBm) (dBm) (dBm) (dBm) (dBm)
--------- ----------------- ---------- --------- --------- ---------
Gi1/1 -6.1 1.0 0.0 -12.0 -13.0
Gi1/2 -5.9 1.0 0.0 -12.0 -13.0
Optical High Alarm High Warn Low Warn Low Alarm
Receive Power Threshold Threshold Threshold Threshold
Port (dBm) (dBm) (dBm) (dBm) (dBm)
------- ----------------- ---------- --------- --------- ---------
Gi1/1 -9.1 1.0 0.0 -26.0 -27.0
Gi1/2 -7.3 1.0 0.0 -26.0 -27.0
On this specific node the graph is working on interface Gi1/1 but not on Gi1/2
Another problem is that the Threshold are not polled by Observium for dbm.

