Details
-
Bug
-
Resolution: Cannot Reproduce
-
 Minor
Minor
-
None
-
None
-
None
-
CentOS 6, Observium revision 3306, PHP 5.3.3, mysql-server 5.1,
Description
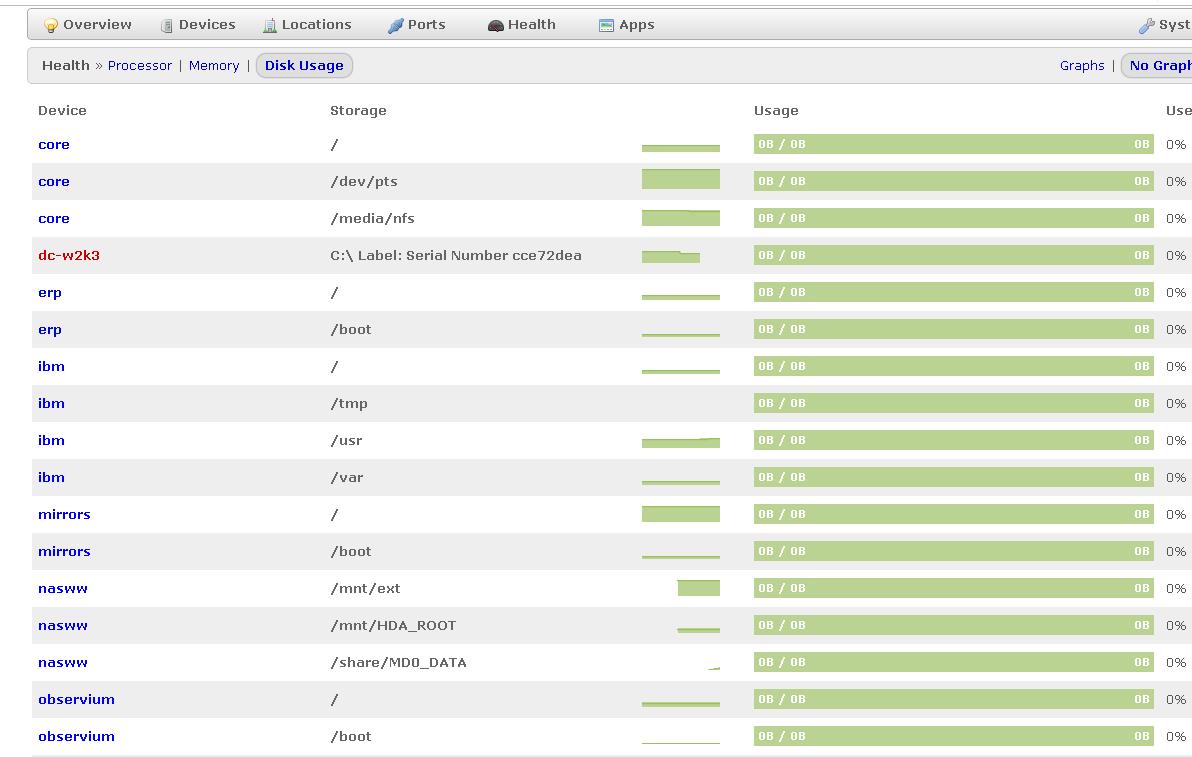
Once you click on master health tab on the web interface and select storage, all items are listed minigraphs are displayed but the "meters" are at 0% and every graph are green, the information does display correctly on the storage health by device.