Details
-
Bug
-
Resolution: Not A Bug
-
 Major
Major
-
None
-
None
-
None
Description
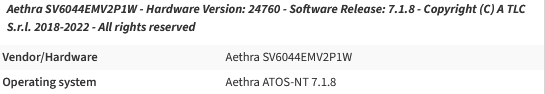
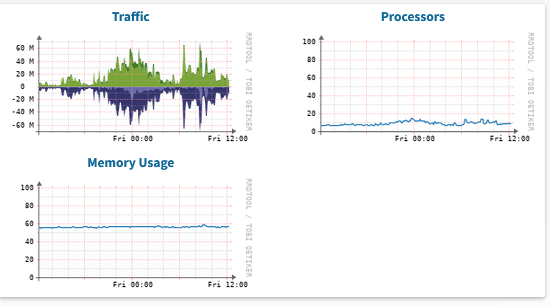
Fresh installation, we connected a router Aethra to the system, we use Professional license, the graph on the left shows the Megas while on the right I don't see it. is it possible fix it? thank you
Attachments
Activity
| Resolution | New: Not A Bug [ 6 ] | |
| Status | Original: Pending Response [ 10000 ] | New: Resolved [ 5 ] |
| Comment |
[ _*General questions and device support can be discussed in [our Discord channel, click here to join|https://discord.gg/GjpNXKWm8W].*_ ---- Please make and attach additional information about the device: * full snmp dump from device: {noformat} snmpwalk -v2c -c <community> -t 3 -Cc --hexOutputLength=0 -Ih -ObentxU <hostname> .1 > myagent.snmpwalk snmpwalk -v2c -c <community> -t 3 -Cc --hexOutputLength=0 -Ih -ObentxU <hostname> .1.3.6.1.4.1 >> myagent.snmpwalk {noformat} _If device not support SNMP version 2c, replace -v2c with -v1._ * If you have problems with discovery or poller processes, please do and attach these debugs: {noformat} ./discovery.php -d -h <device> ./poller.php -d -h <device> {noformat} * additionally attach device and/or vendor specific MIB files ---- {color:#505F79}_This comment is added automatically._{color} ] |
| Component/s | New: Graphs [ 11100 ] | |
| Component/s | New: Web Interface [ 10002 ] | |
| Component/s | Original: Default [ 10900 ] |
| Assignee | Original: Mike Stupalov [ landy ] | New: Adam Armstrong [ adama ] |
| Component/s | New: Default [ 10900 ] |
| Assignee | Original: Adam Armstrong [ adama ] | New: Mike Stupalov [ landy ] |
| Status | Original: Open [ 1 ] | New: Pending Response [ 10000 ] |
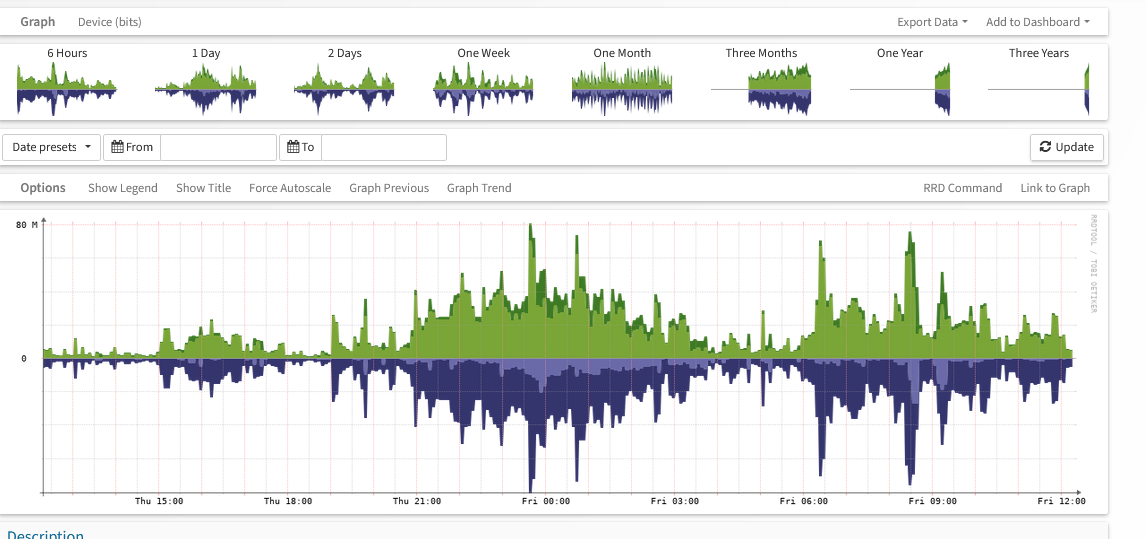
This is just standard behaviour of the graphing library. We can't really control where it puts the scale ticks, it's an internal function of rrdtool. In some conditions it might chose to just draw a single tick label.
You can see on the graph the other tick lines on the scale match 20, 40 and 60Mbps.