Details
-
Bug
-
Resolution: Not A Bug
-
 Minor
Minor
-
None
-
None
-
None
Description
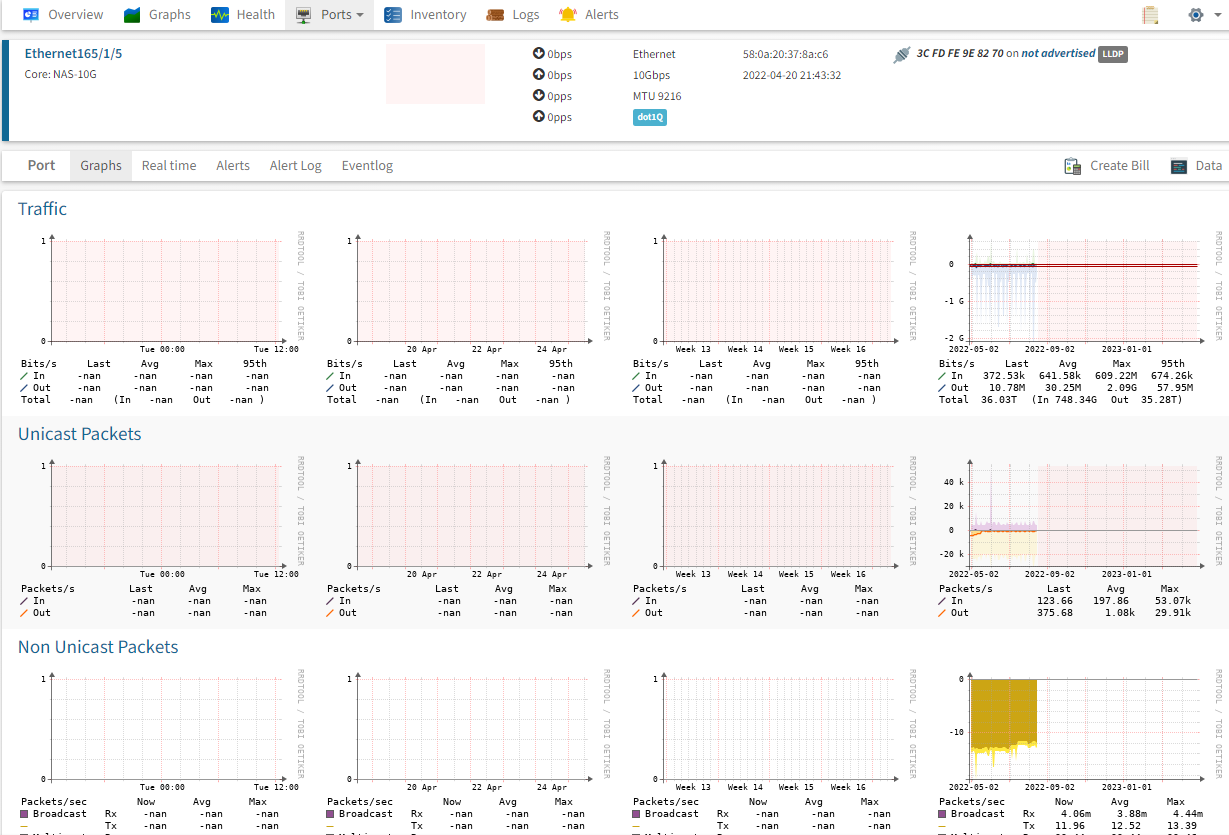
N2K-C2232PP-10GE seem to be not displaying interface graphics anymore.
I am unsure of which version this issue has started.
Attachments
Activity
Hello
I updated to 23.4.12651 (13th April 2023)
I ran "./poller.php -d -h <device>" but the issue is still there.
Please by first update to latest revision.
Second, make poller debug for:
./poller.php -d -h <device>
|
Please run debug from user used in cron, ie if this is 'observium' user:
sudo -u observium /opt/observium/poller.php -d -h <device>
|
other fex-s that aren't this model seem to be working fine and nexus interfaces also seem to be working fine.
General questions and device support can be discussed in our Discord channel, click here to join.
Please make and attach additional information about the device:
- full snmp dump from device:
snmpwalk -v2c -c <community> -t 3 -Cc --hexOutputLength=0 -ObentxU <hostname> .1 > myagent.snmpwalksnmpwalk -v2c -c <community> -t 3 -Cc --hexOutputLength=0 -ObentxU <hostname> .1.3.6.1.4.1 >> myagent.snmpwalkIf device not support SNMP version 2c, replace -v2c with -v1.
- If you have problems with discovery or poller processes, please do and attach these debugs:
./discovery.php -d -h <device>./poller.php -d -h <device>
- additionally attach device and/or vendor specific MIB files
This comment is added automatically.
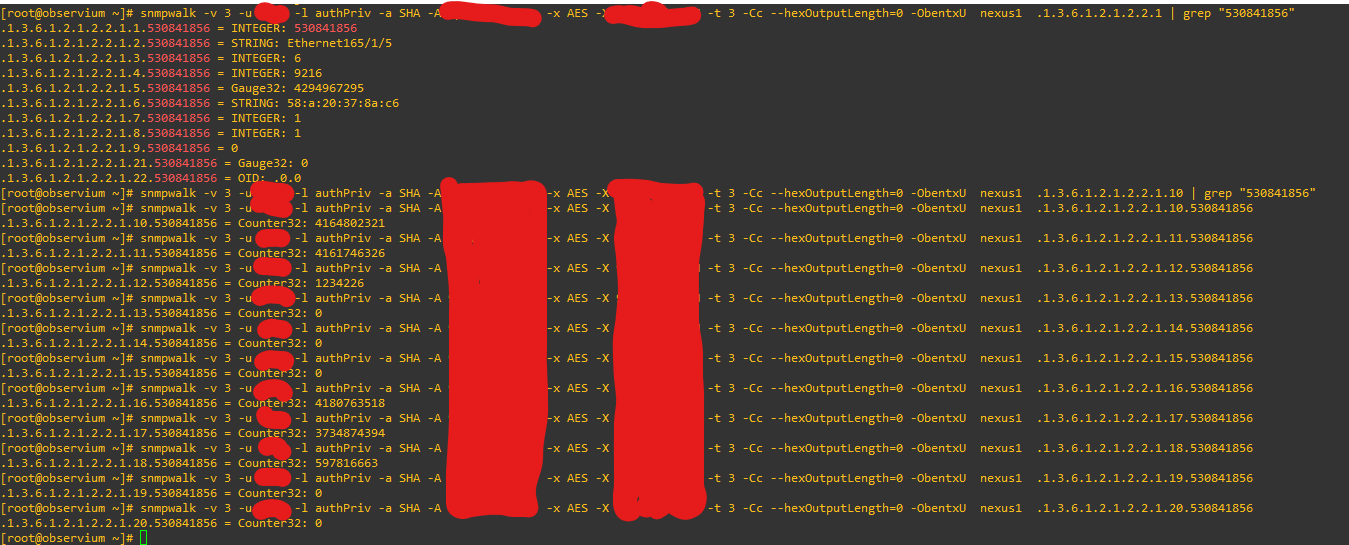
This device is not returning counters for these ports. This is probably something you need to ask Cisco about.
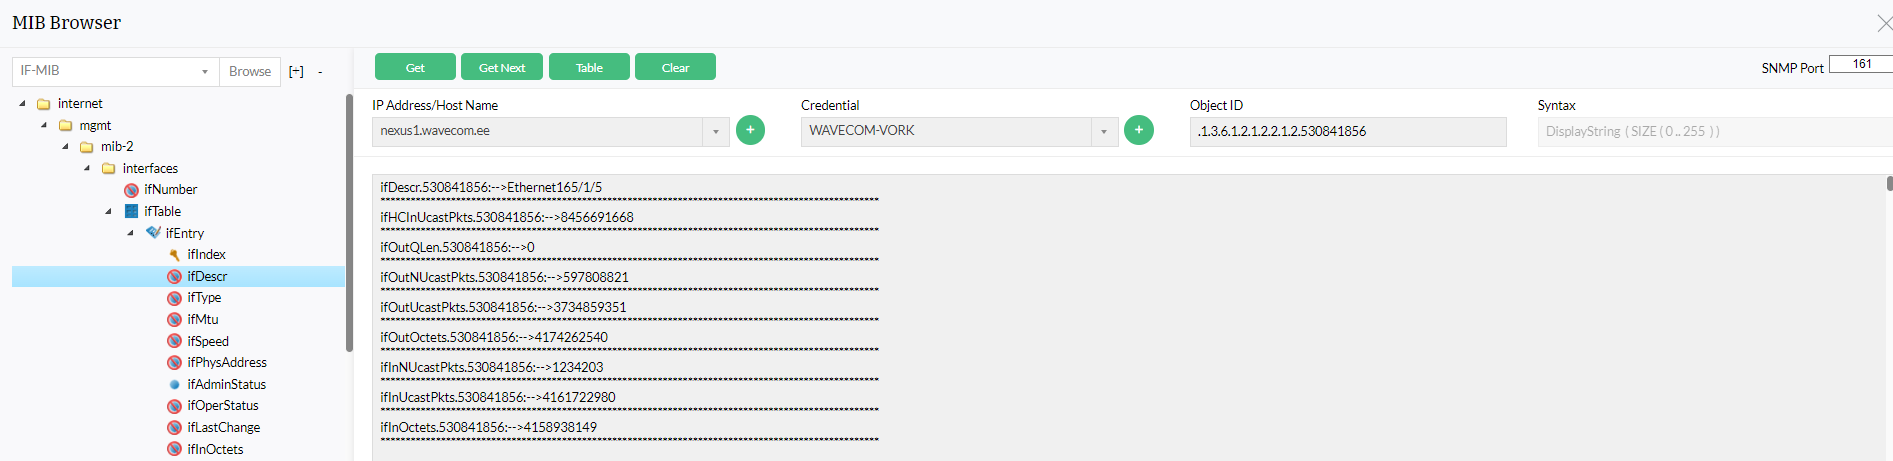
The port in the screenshot is ifIndex 530841856
You can see the lack of counters :
root@web:~# grep '165/1/5' poller.output
ifDescr.530841856 = Ethernet165/1/5
ifName.530841856 = Ethernet165/1/5
| 530841856 | Et165/1/5 | Ethernet | 10Gbps | 0bps | 0bps | 0B | 0B | 0 | 0 | Y |
root@web:~#
root@web:~# grep '530841856' poller.output | grep ^if
ifIndex.530841856 = 530841856
ifDescr.530841856 = Ethernet165/1/5
ifType.530841856 = ethernetCsmacd
ifMtu.530841856 = 9216
ifSpeed.530841856 = 4294967295
ifPhysAddress.530841856 = 58:a:20:37:8a:c6
ifAdminStatus.530841856 = up
ifOperStatus.530841856 = up
ifLastChange.530841856 = 0:0:00:00.00
ifOutQLen.530841856 = 0
ifSpecific.530841856 = zeroDotZero
ifName.530841856 = Ethernet165/1/5
ifLinkUpDownTrapEnable.530841856 = enabled
ifHighSpeed.530841856 = 10000
ifPromiscuousMode.530841856 = false
ifConnectorPresent.530841856 = true
ifAlias.530841856 = Core: NAS-10G
root@web:~#
Where as the slot 1 ports seem to have counters:
root@web:~# grep '1241513984' poller.output | grep ^if
ifIndex.1241513984 = 1241513984
ifDescr.1241513984 = ii1/1/1
ifType.1241513984 = ethernetCsmacd
ifMtu.1241513984 = 9216
ifSpeed.1241513984 = 4294967295
ifPhysAddress.1241513984 =
ifAdminStatus.1241513984 = up
ifOperStatus.1241513984 = up
ifLastChange.1241513984 = 0:0:00:00.00
ifInOctets.1241513984 = 3868081343
ifInUcastPkts.1241513984 = 633757751
ifInNUcastPkts.1241513984 = 470411029
ifInDiscards.1241513984 = 0
ifInErrors.1241513984 = 0
ifInUnknownProtos.1241513984 = 0
ifOutOctets.1241513984 = 2013542020
ifOutUcastPkts.1241513984 = 2405346490
ifOutNUcastPkts.1241513984 = 2249443135
ifOutDiscards.1241513984 = 482
ifOutErrors.1241513984 = 0
ifOutQLen.1241513984 = 0
ifSpecific.1241513984 = zeroDotZero
ifName.1241513984 = ii1/1/1
ifInMulticastPkts.1241513984 = 453422264
ifInBroadcastPkts.1241513984 = 16988765
ifOutMulticastPkts.1241513984 = 1679766167
ifOutBroadcastPkts.1241513984 = 569676968
ifHCInOctets.1241513984 = 1048761867320511
ifHCInUcastPkts.1241513984 = 1078670549047
ifHCInMulticastPkts.1241513984 = 453422264
ifHCInBroadcastPkts.1241513984 = 16988765
ifHCOutOctets.1241513984 = 537551530374788
ifHCOutUcastPkts.1241513984 = 526391356602
ifHCOutMulticastPkts.1241513984 = 14564668055
ifHCOutBroadcastPkts.1241513984 = 4864644264
ifLinkUpDownTrapEnable.1241513984 = disabled
ifHighSpeed.1241513984 = 42000
ifPromiscuousMode.1241513984 = false
ifConnectorPresent.1241513984 = false
ifAlias.1241513984 =
ifCounterDiscontinuityTime.1241513984 = 284:2:23:54.47
root@web:~#
We collect port traffic counters from IF-MIB, probably the most standardised MIB that exists. There's almost zero scope for any thing on our side to affect collecting this that wouldn't break everything.
This is a Cisco bug.
Thanks,
adam.